Giao dịch
Loại giao dịch
Giao ngay
Giao dịch tiền điện tử một cách tự do
Trước giờ mở cửa
Giao dịch các token mới trước khi chúng được niêm yết chính thức
Giao dịch ký quỹ
Tăng lợi nhuận của bạn với đòn bẩy
Giao dịch khối & Chuyển đổi
0 Fees
Giao dịch bất kể khối lượng, không mất phí, không trượt giá
Alpha
Point
Nhận các token đầy hứa hẹn trong giao dịch trên chuỗi được tối ưu hóa
Token đòn bẩy
Sản phẩm ETF có thuộc tính đòn bẩy, giao dịch giao ngay, không cần vay, không cháy tải khoản
Futures
Futures
Hàng trăm hợp đồng được thanh toán bằng USDT hoặc BTC
Quyền chọn
HOT
Giao dịch với các quyền chọn kiểu Châu Âu
Tài khoản hợp nhất
Tối đa hóa hiệu quả sử dụng vốn của bạn
Giao dịch demo
Bắt đầu với Hợp đồng
Nắm vững kỹ năng giao dịch hợp đồng từ đầu
Sự kiện tương lai
Tham gia các sự kiện để giành được những phần thưởng hậu hĩnh
Giao dịch demo
Sử dụng tiền ảo để trải nghiệm giao dịch không rủi ro
Kiếm tiền
Launch
CandyDrop
Sưu tập kẹo để kiếm airdrop
Launchpool
Thế chấp nhanh, kiếm token mới tiềm năng
HODLer Airdrop
Nắm giữ GT và nhận được airdrop lớn miễn phí
Launchpad
Đăng ký sớm dự án token lớn tiếp theo
Điểm Alpha
NEW
Giao dịch tài sản on-chain và tận hưởng phần thưởng airdrop!
Điểm Futures
NEW
Kiếm điểm futures và nhận phần thưởng airdrop
Đầu tư
Simple Earn
Kiếm lãi từ các token nhàn rỗi
Đầu tư tự động
Đầu tư tự động một cách thường xuyên.
Sản phẩm tiền kép
Mua thấp và bán cao để kiếm lợi nhuận từ biến động giá
Soft Staking
Kiếm phần thưởng với staking linh hoạt
Vay Crypto
0 Fees
Thế chấp một loại tiền điện tử để vay một loại khác
Trung tâm cho vay
Trung tâm cho vay một cửa
Trung tâm tài sản VIP
Quản lý tài sản tùy chỉnh giúp tăng trưởng tài sản của bạn
Quản lý tài sản cá nhân
Quản lý tài sản tùy chỉnh giúp tăng trưởng tài sản kỹ thuật số của bạn
Quỹ định lượng
Đội ngũ quản lý tài sản hàng đầu giúp bạn kiếm lợi nhuận mà không cần lo lắng
Staking
Stake tiền điện tử để kiếm tiền từ các sản phẩm PoS
Đòn bẩy thông minh
NEW
Không bị thanh lý bắt buộc trước hạn, không phải lo lắng về lợi nhuận đòn bẩy
Đúc GUSD
Sử dụng USDT/USDC để đúc GUSD với lợi suất tương đương kho bạc
Thêm
Khuyến mãi
Trung tâm hoạt động
Tham gia các hoạt động và giành nhiều giải thưởng tiền mặt lớn cùng nhiều quà tặng độc quyền
Giới thiệu
20 USDT
Kiếm 40% hoa hồng hoặc phần thưởng lên đến 500 USDT
Thông báo
Thông báo về niêm yết mới, hoạt động, nâng cấp, v.v.
Gate Blog
Các Bài Báo Về Tiền Điện Tử
Dịch vụ VIP
Chiết khấu phí lớn
Bằng chứng dự trữ
Gate cam kết 100% bằng chứng dự trữ
Đại lý
Tận hưởng hoa hồng độc quyền và kiếm được lợi nhuận cao
Quản lý tài sản
NEW
Giải pháp quản lý tài sản toàn diện
Tổ chức
NEW
Giải pháp tài sản kỹ thuật số chuyên nghiệp cho các tổ chức
Chuyển khoản ngân hàng OTC
Nạp và rút tiền pháp định
Chương trình Môi giới
Cơ chế hoàn tiền API hào phóng
Gate Vault
Giữ tài sản của bạn an toàn
Asiftahsin
Chia sẻ phân tích thị trường liên quan đến Tiền điện tử, chia sẻ kiến thức liên quan đến Tiền điện tử cho người theo dõi của tôi (anh em)
Ghim
Asiftahsin
Nếu bạn thích buổi phát trực tiếp của tôi, vui lòng bỏ phiếu cho nó. 👍
https://www.gate.com/activities/community-vote-2025?ref=BARCV1FY&refUid=13525639&ref_type=165&utm_cmp=xjdtmcgP
Xem bản gốchttps://www.gate.com/activities/community-vote-2025?ref=BARCV1FY&refUid=13525639&ref_type=165&utm_cmp=xjdtmcgP

- Phần thưởng
- 13
- 7
- Đăng lại
- Retweed
Discovery:
Chuyến tăng giá Giáng Sinh! 🐂Xem thêm
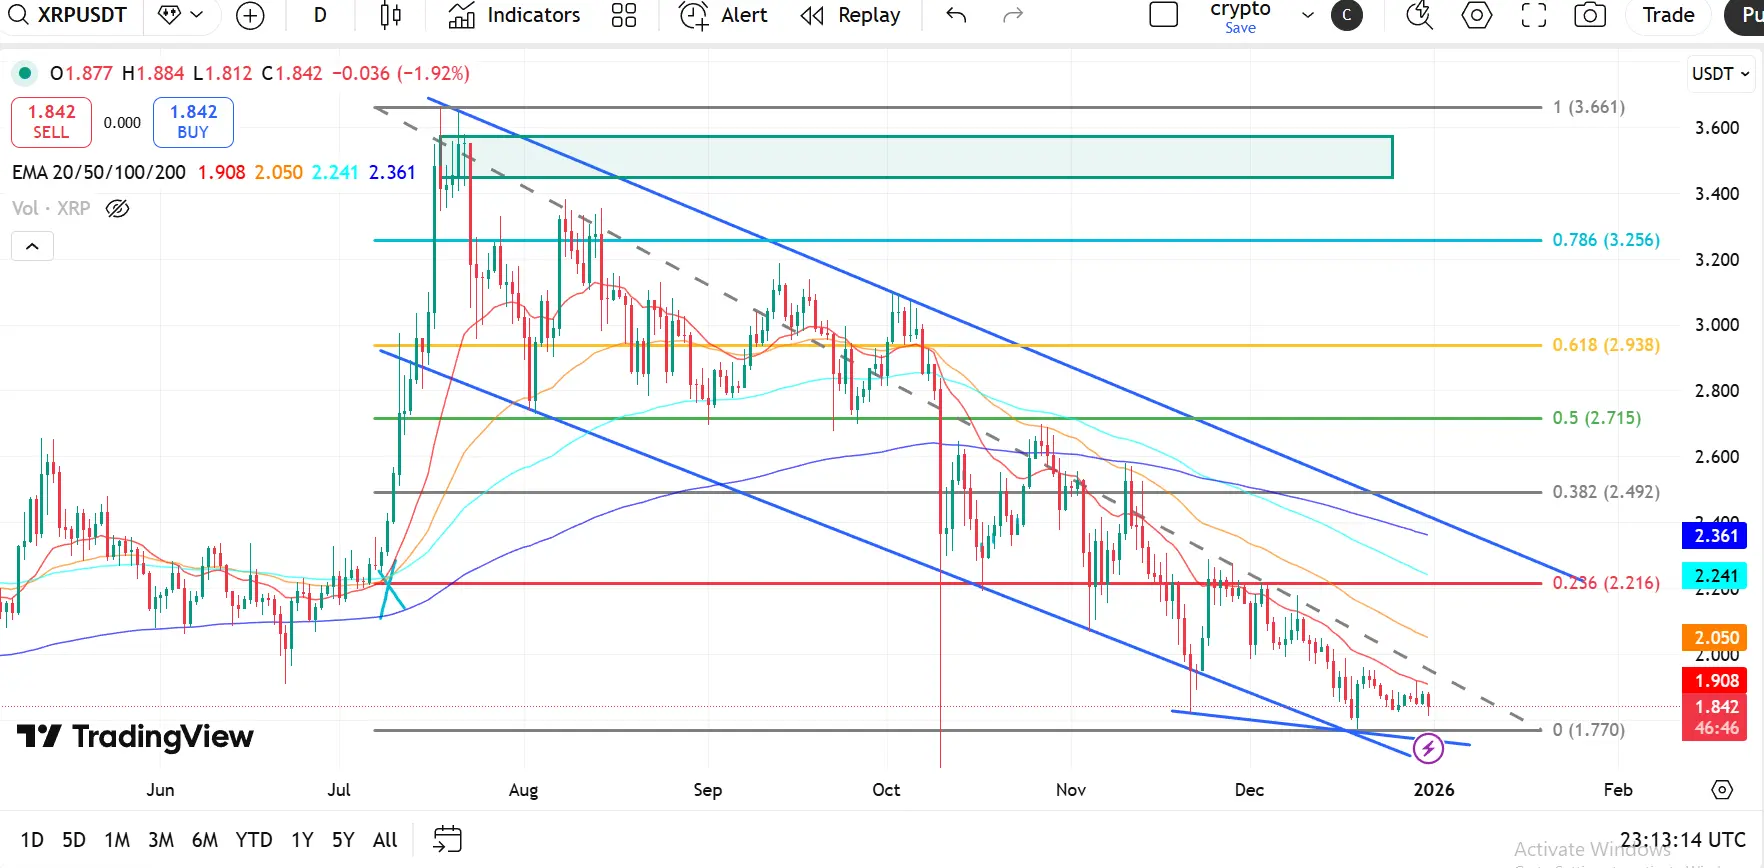
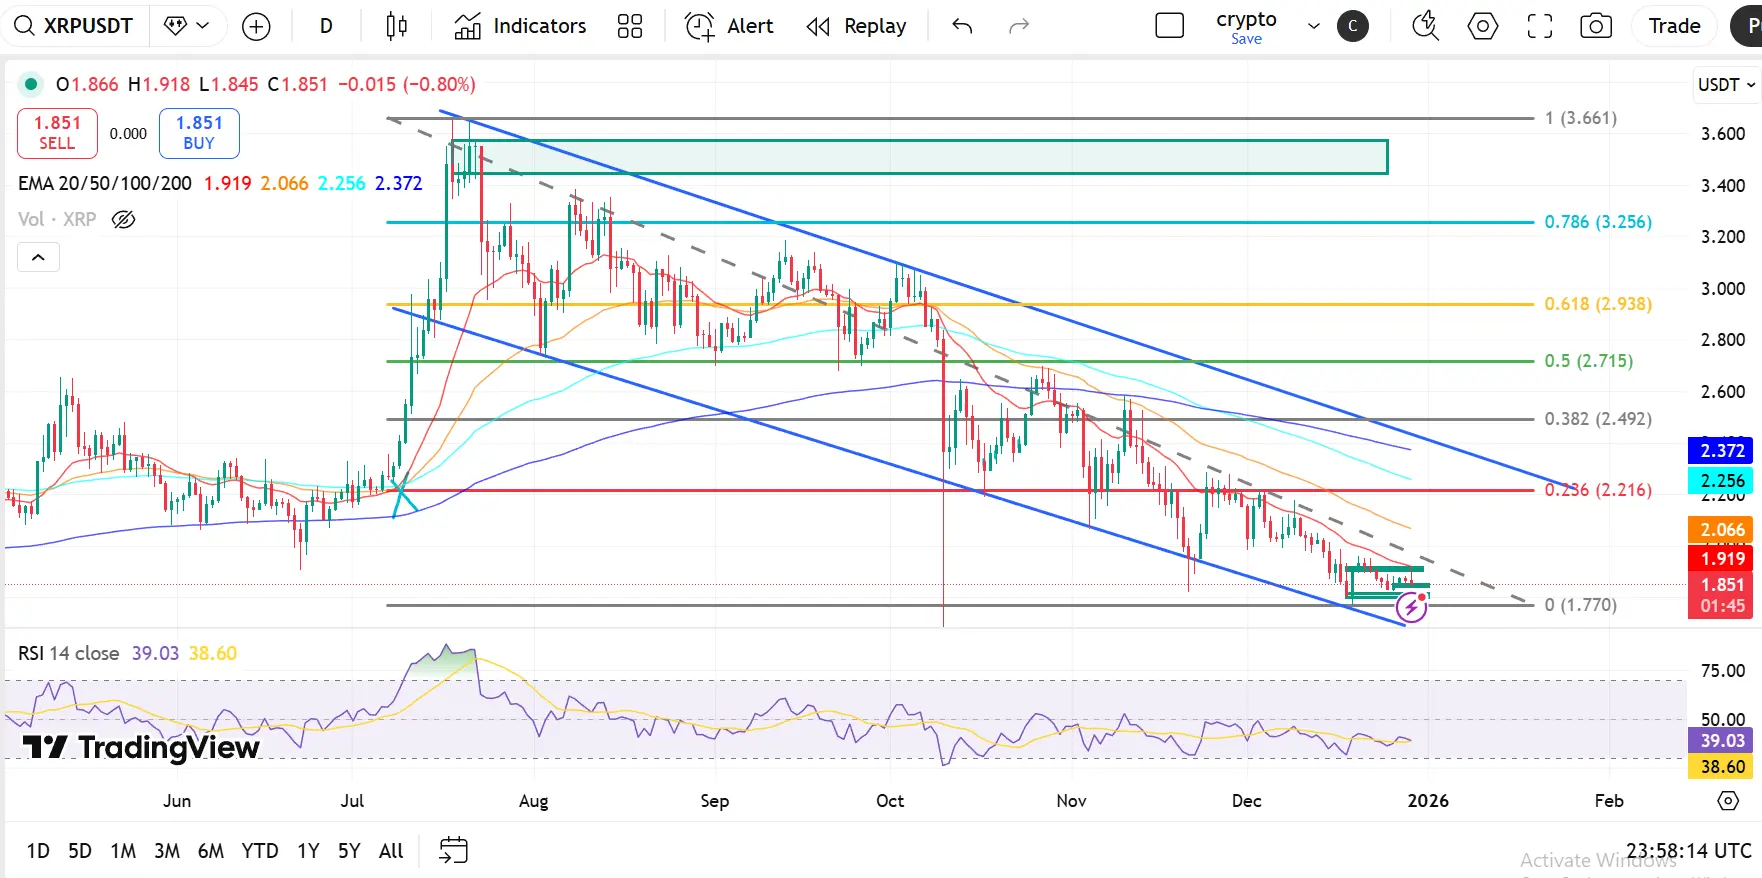
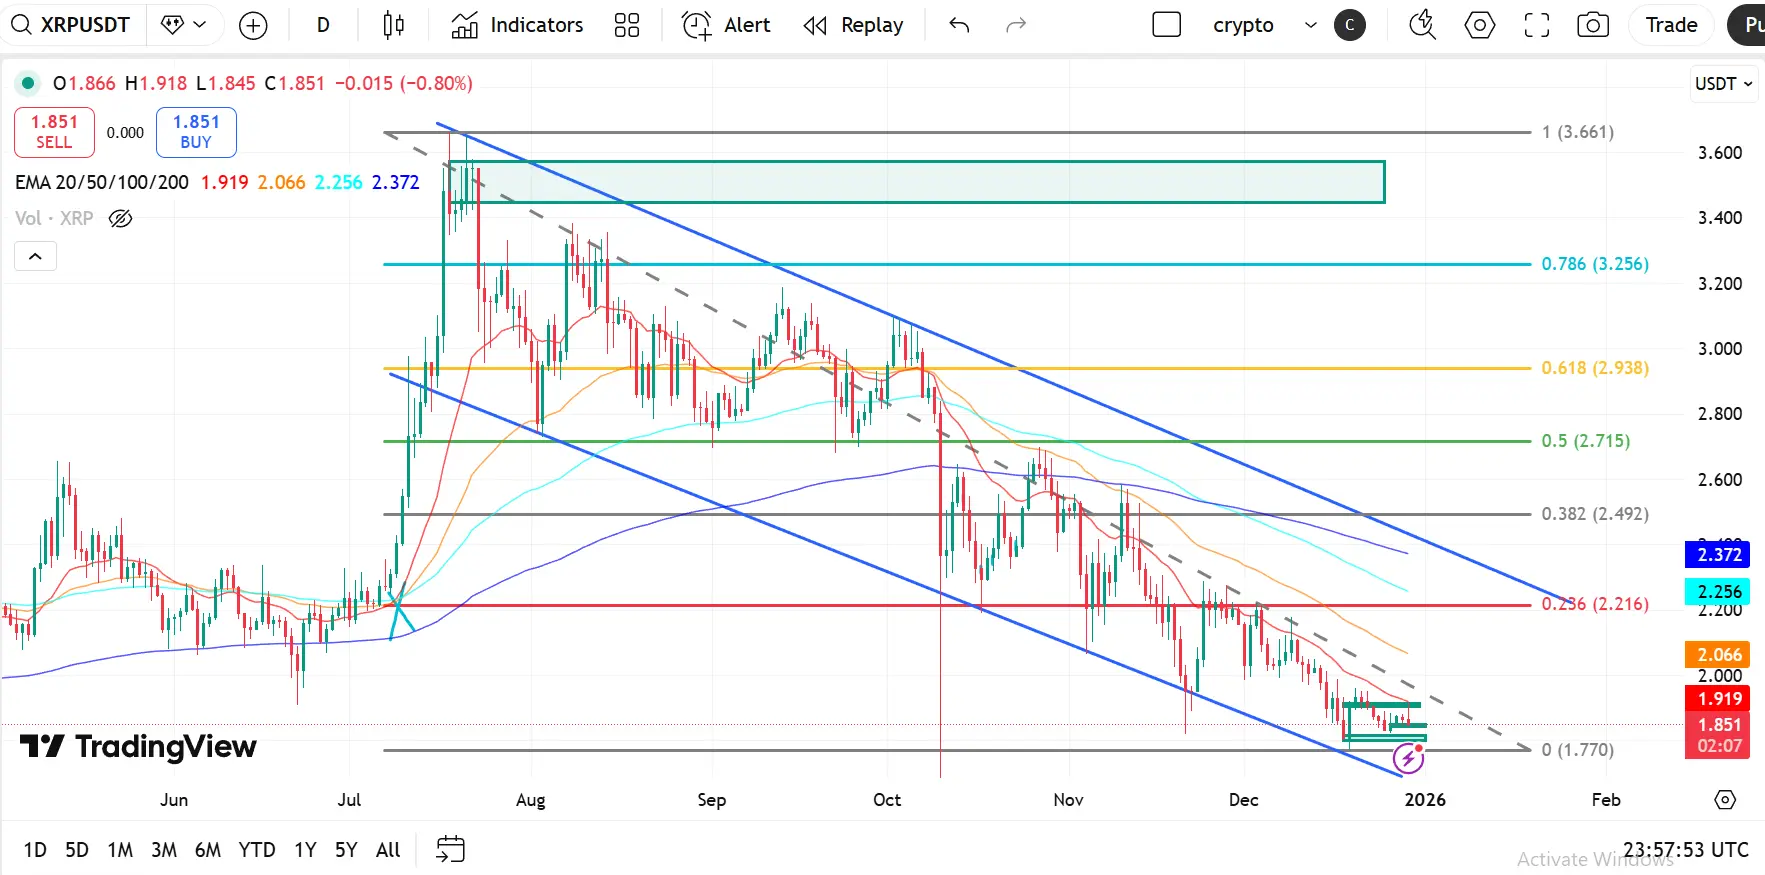
Triển vọng kỹ thuật XRP: Giá nén chặt tại hỗ trợ kênh trong xu hướng giảm kéo dài
XRP vẫn duy trì cấu trúc giảm rõ ràng, giao dịch trong một kênh giảm rõ ràng sau khi bị từ chối mạnh khỏi vùng cung vĩ mô $3.40–$3.65, nơi giá đạt đỉnh gần mức Fib 1.0. Sự từ chối này đánh dấu giai đoạn phân phối lớn, kết thúc pha tăng giá trước đó.
Xu hướng giảm đã tăng tốc khi XRP mất vùng $2.94–$2.71 (0.618–0.5 Fib), xác nhận sự đảo chiều xu hướng và chuyển quyền kiểm soát thị trường hoàn toàn về phía người bán.
Cấu trúc EMA (Thống nhất giảm)
EMA 20: $1.908
EMA 50: $2.050
EMA 100: $2.241
EMA 200: $2.361
Tất cả
XRP1,9%

- Phần thưởng
- 6
- 6
- Đăng lại
- Retweed
Ryakpanda:
Chỉ cần lao vào thôi💪Xem thêm
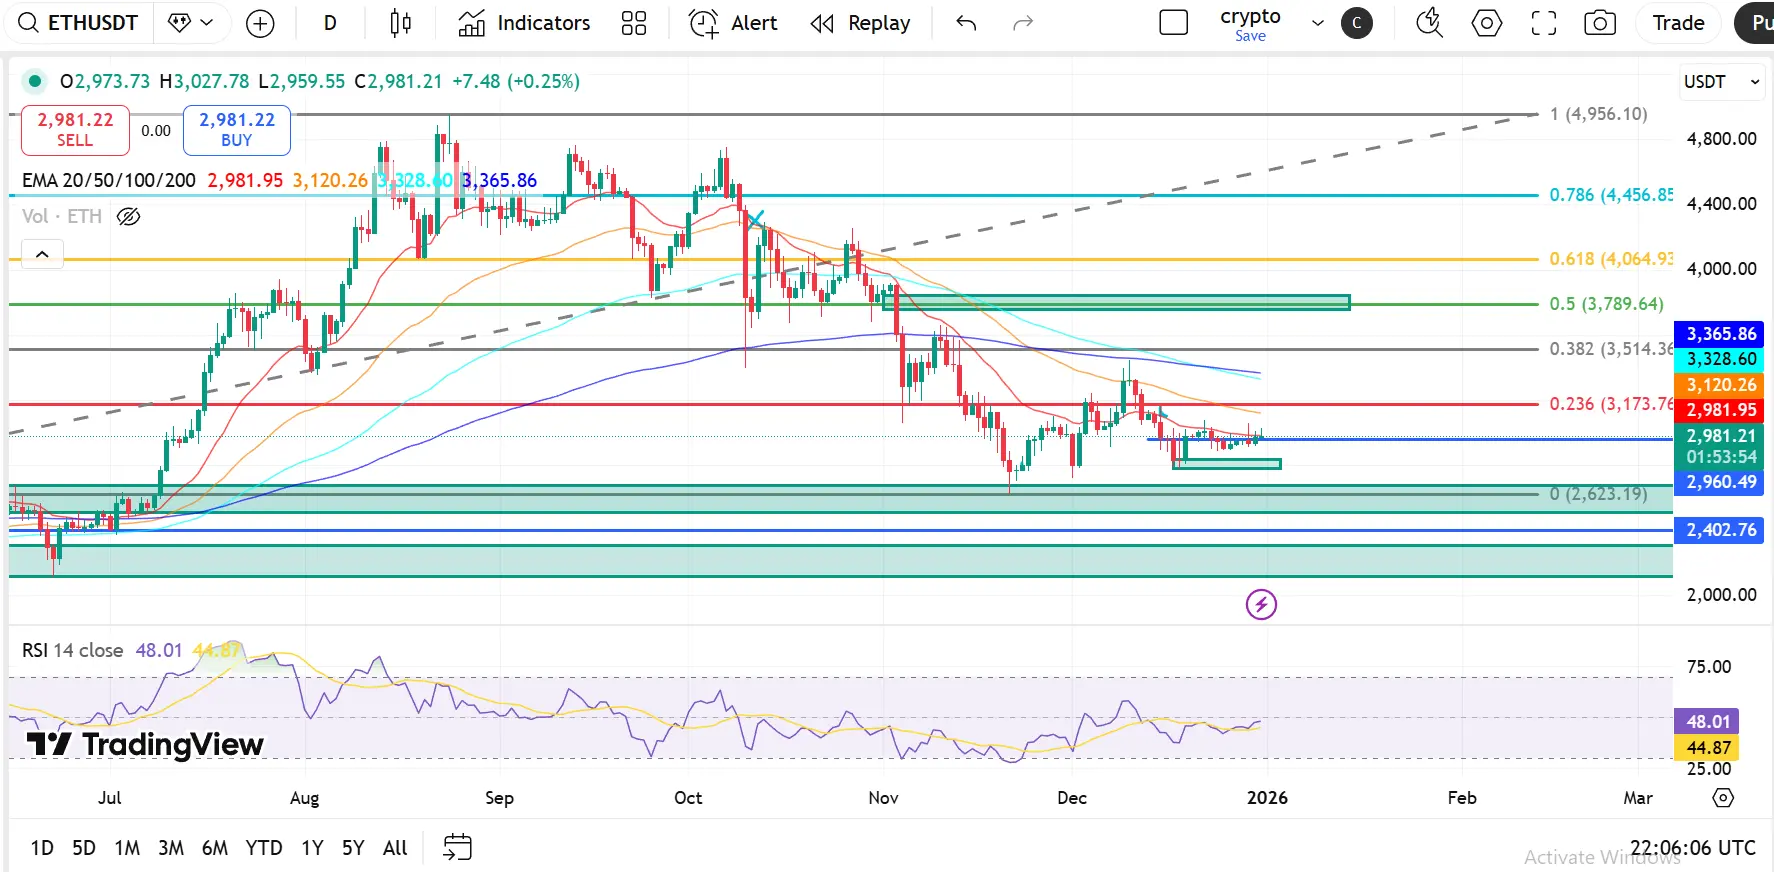
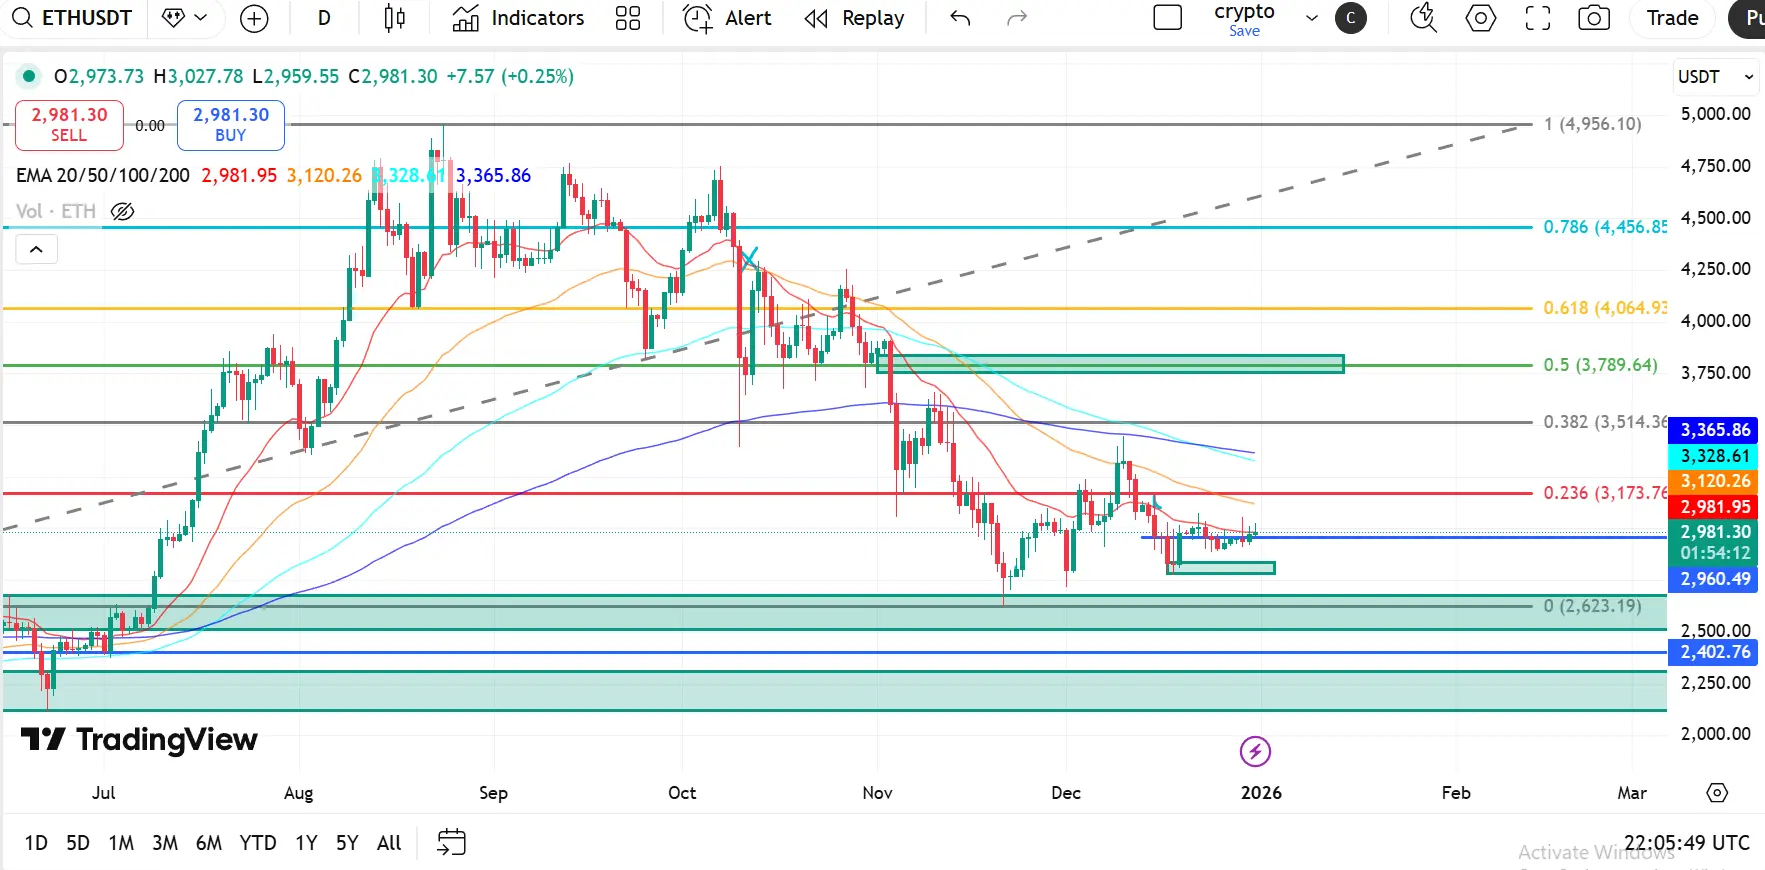
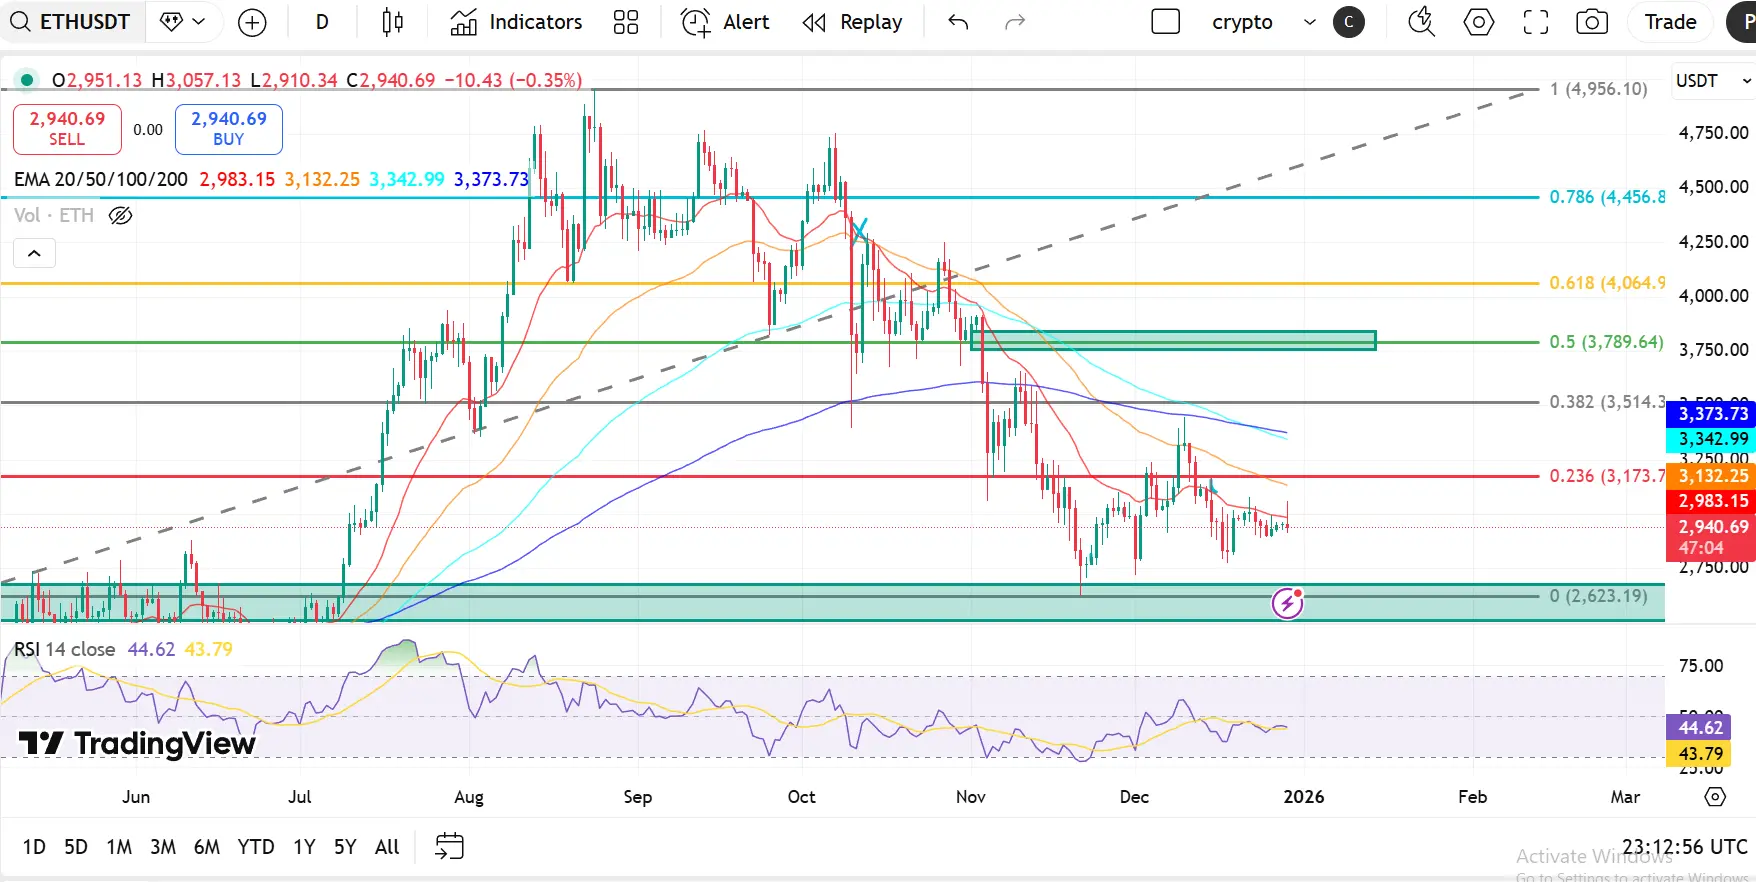
Triển vọng kỹ thuật ETH: Ethereum củng cố trên mức cầu chính sau khi phá vỡ cấu trúc
Ethereum vẫn trong một cấu trúc thị trường giảm sau khi bị từ chối mạnh khỏi vùng cung vĩ mô $4,450–$4,950, nơi giá thất bại gần các mức Fibonacci 0.786–1.0. Sự từ chối này đánh dấu một giai đoạn phân phối rõ ràng, kết thúc xu hướng tăng trước đó và kích hoạt một đợt giảm kéo dài.
Việc phá vỡ diễn ra nhanh hơn khi ETH mất vùng $4,065–$3,790 (0.618–0.5 Fib), biến vùng chính này thành kháng cự mạnh phía trên.
Cấu trúc EMA (Thị trường giảm)
EMA 20 – $2,981
EMA 50 – $3,120
EMA 100 – $3,328
EMA 200 – $3,365
ETH đan
ETH0,33%
- Phần thưởng
- 32
- 16
- 1
- Retweed
Miss_1903:
Cảm ơn bạn đã cung cấp thông tin 🤗🍀Xem thêm
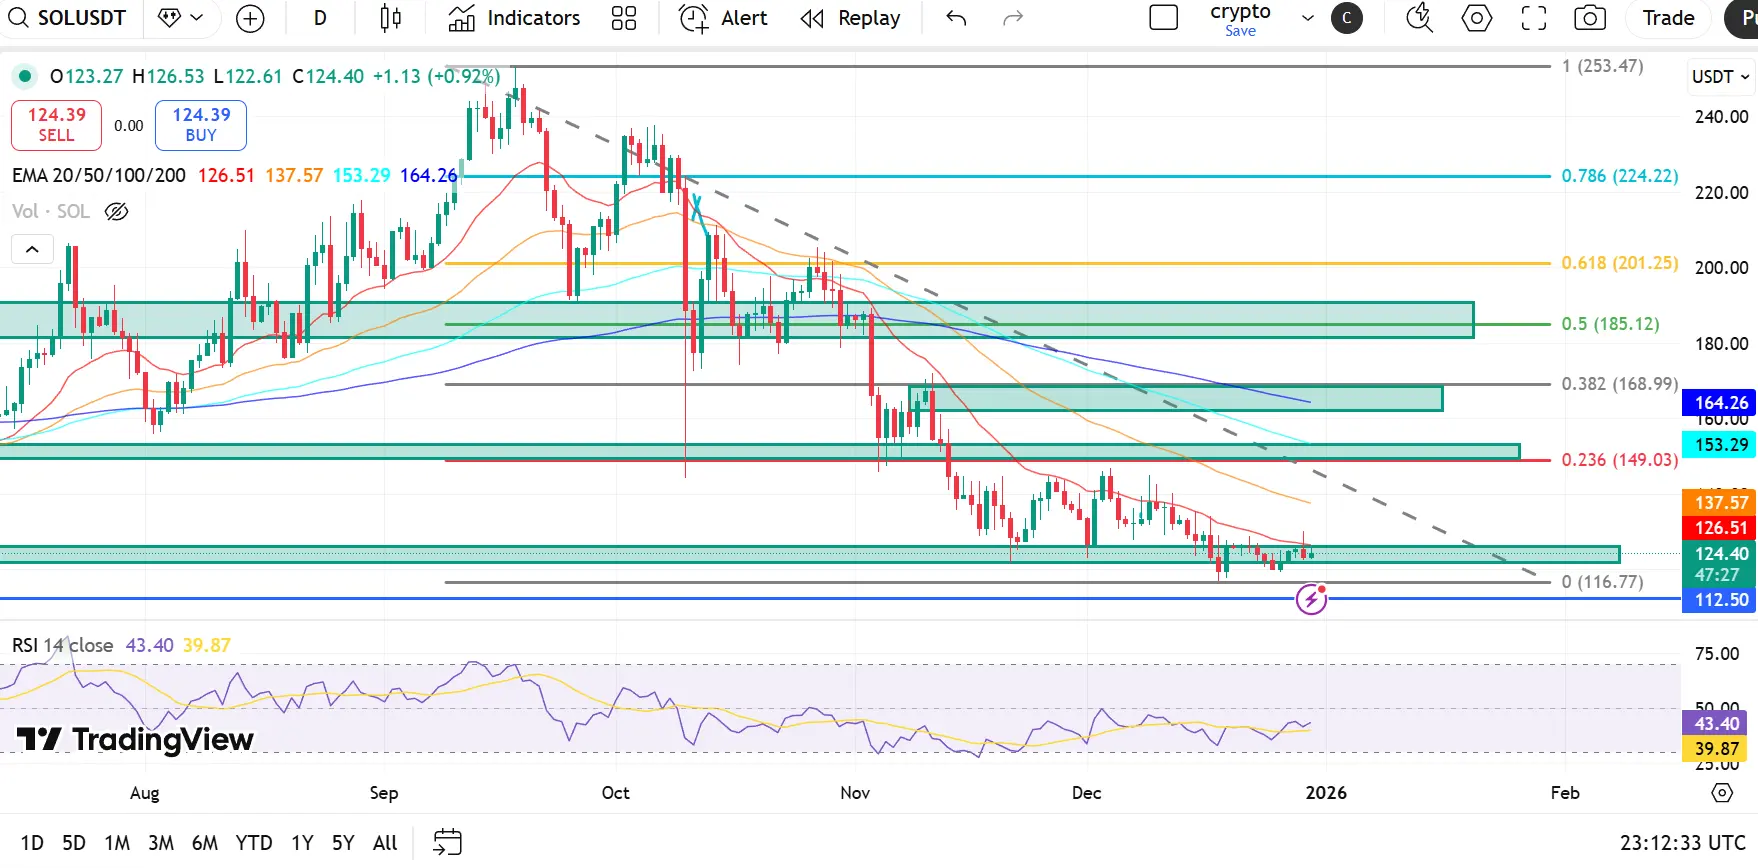
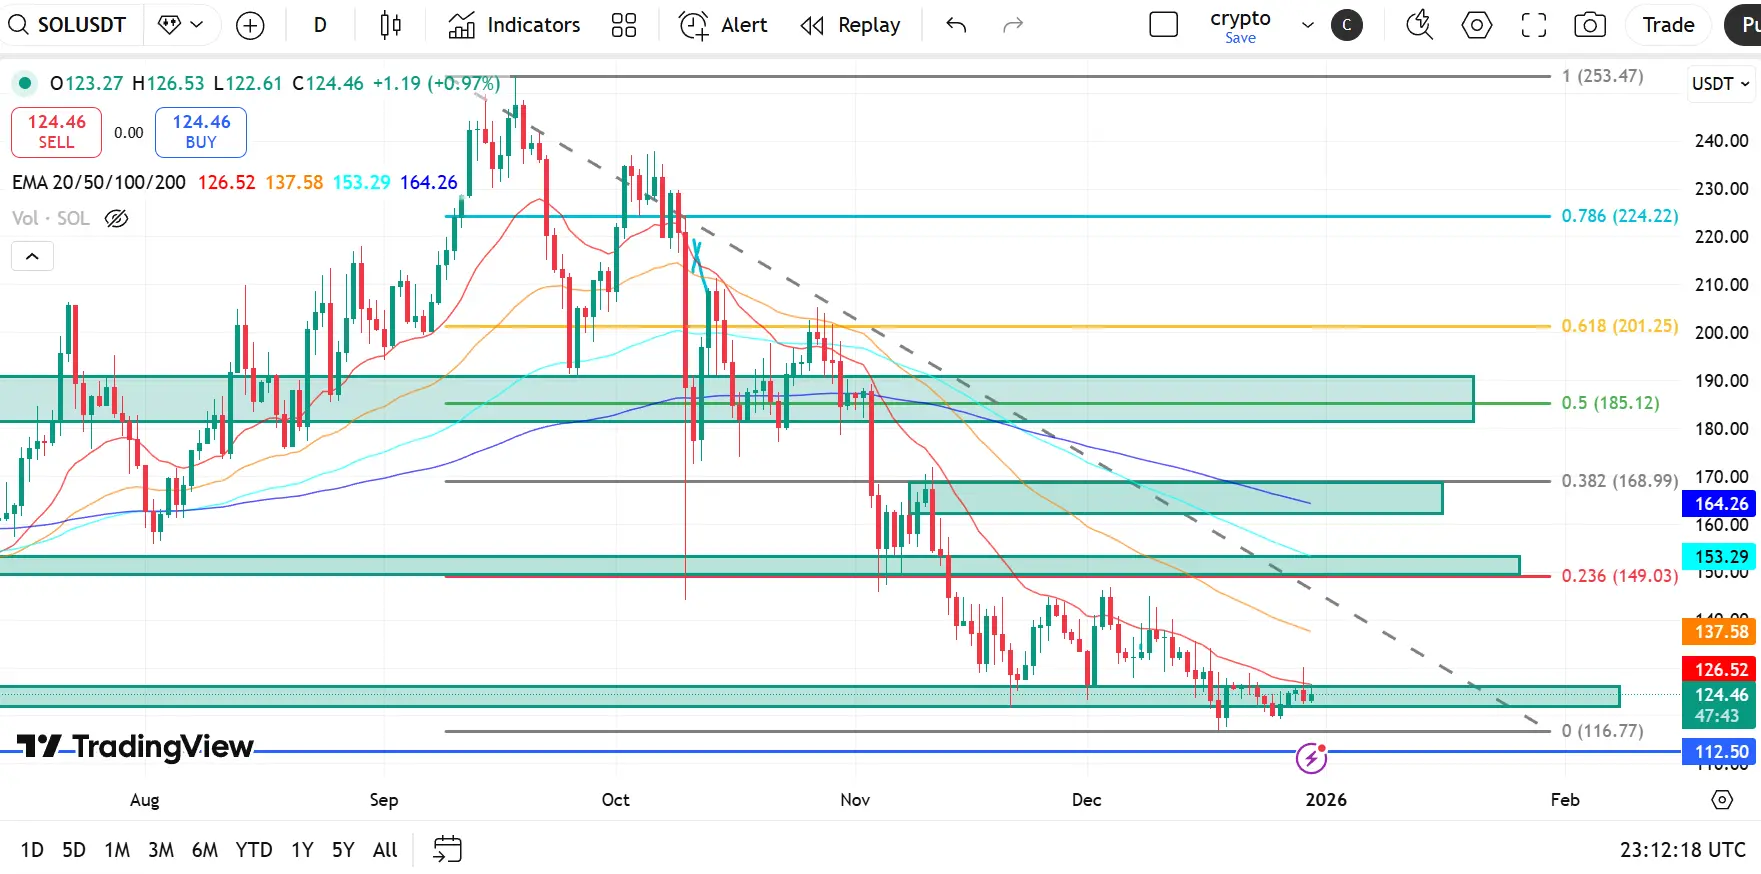
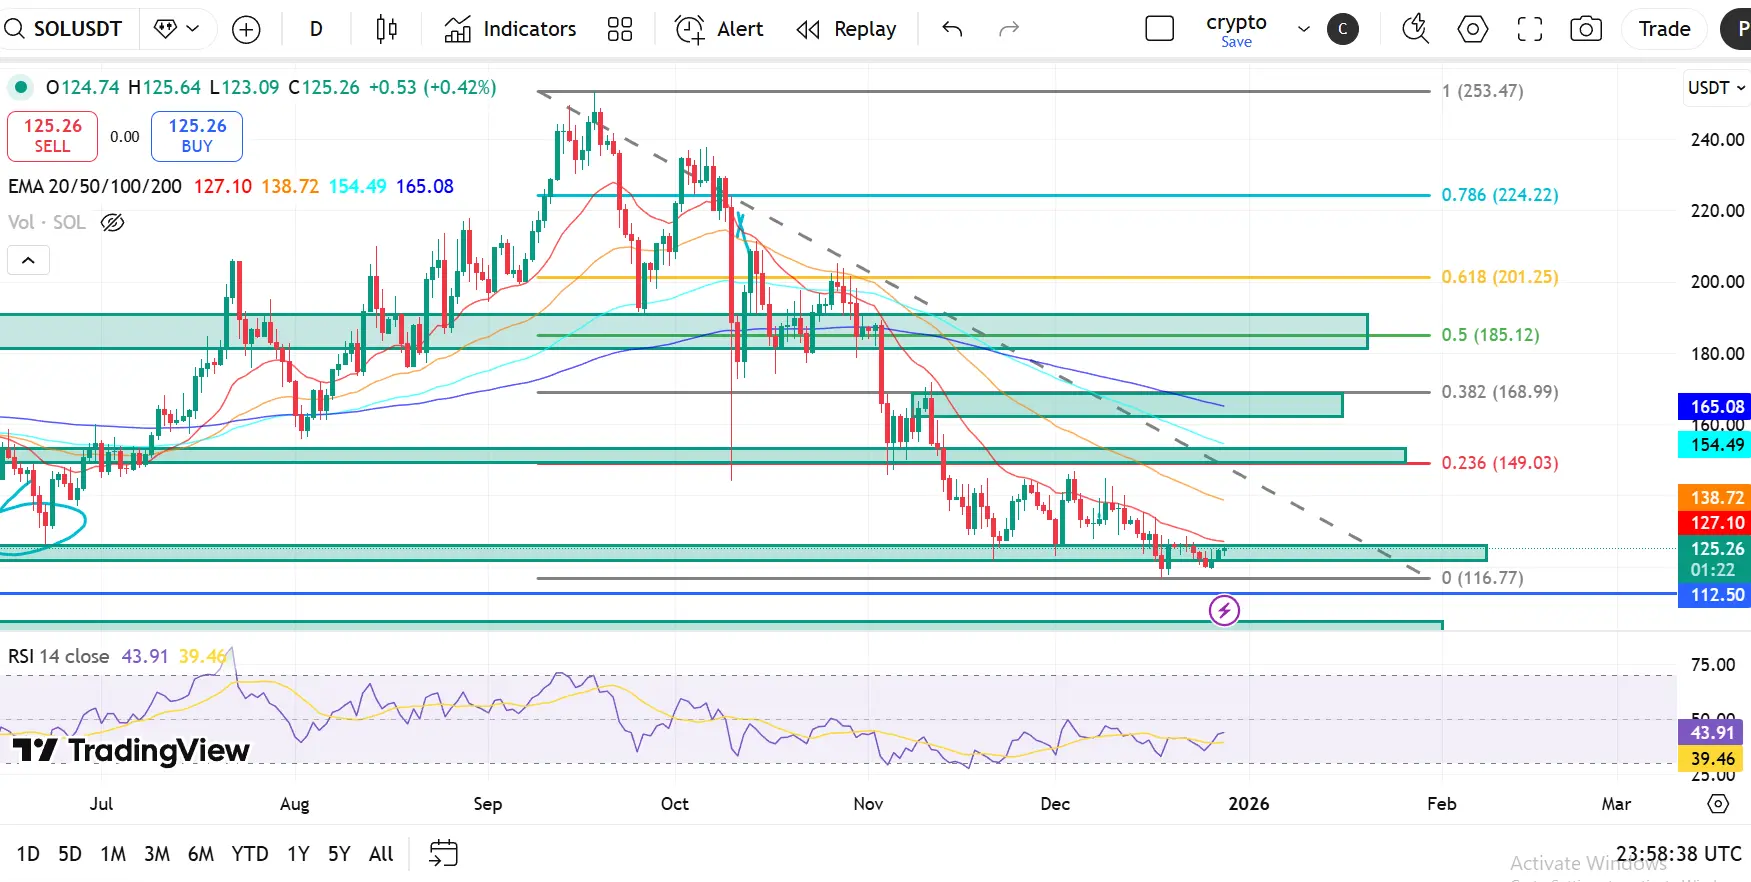
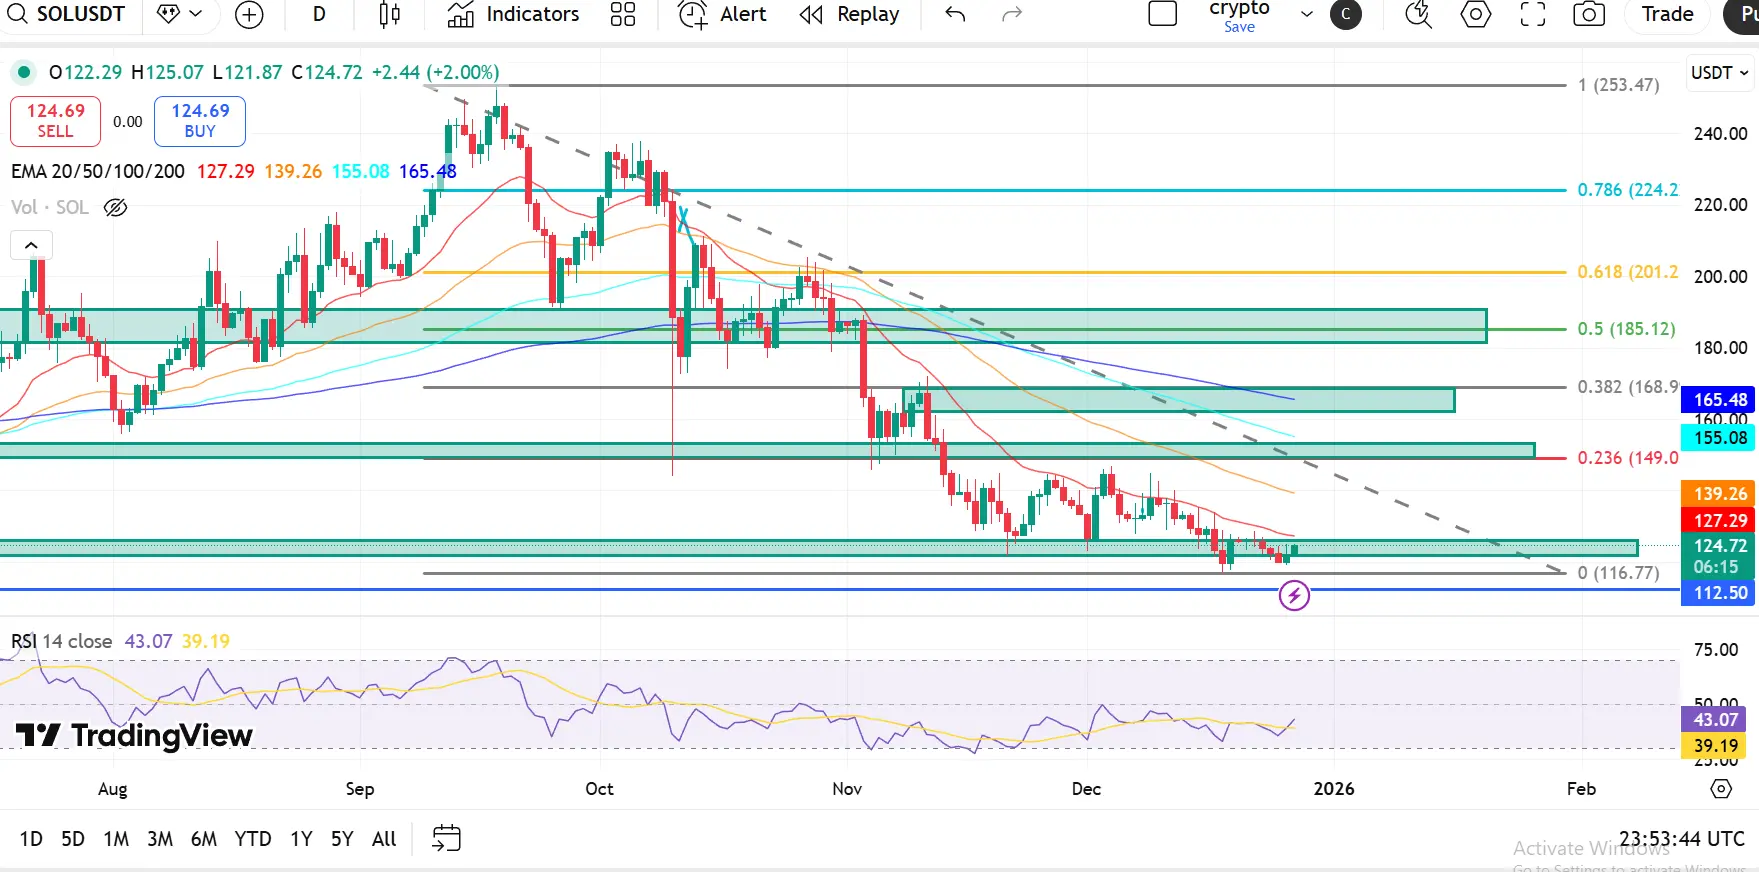
Triển vọng kỹ thuật của SOL: Solana tích lũy tại vùng cầu chính sau đà giảm dài hạn
Solana vẫn chịu áp lực giảm sau khi bị từ chối mạnh tại vùng cung lớn $225–$253 , nơi giá đạt đỉnh gần các mức Fibonacci 0.786–1.0. Vùng này đánh dấu giai đoạn phân phối rõ ràng, kích hoạt đà giảm kéo dài.
Áp lực bán gia tăng khi SOL mất vùng $201–$185 (0.618–0.5 Fib), xác nhận sự phá vỡ cấu trúc và biến vùng quan trọng này thành kháng cự mạnh.
Cấu trúc EMA (Thứ tự giảm)
EMA 20 – $126.52
EMA 50 – $137.57
EMA 100 – $153.29
EMA 200 – $164.26
Giá đang giao dịch dưới tất cả các EMA chính, với các EMA 20/50/100/200
SOL1,18%
- Phần thưởng
- 29
- 16
- Đăng lại
- Retweed
GateUser-fa1d8e41 :
:
Lợi nhuận chỉ là bao nhiêu và số mạng được ghi là 22, và tôi cũng đã tăng lên 0.12700 nhưng không thấy lợi nhuận nào tại saoXem thêm
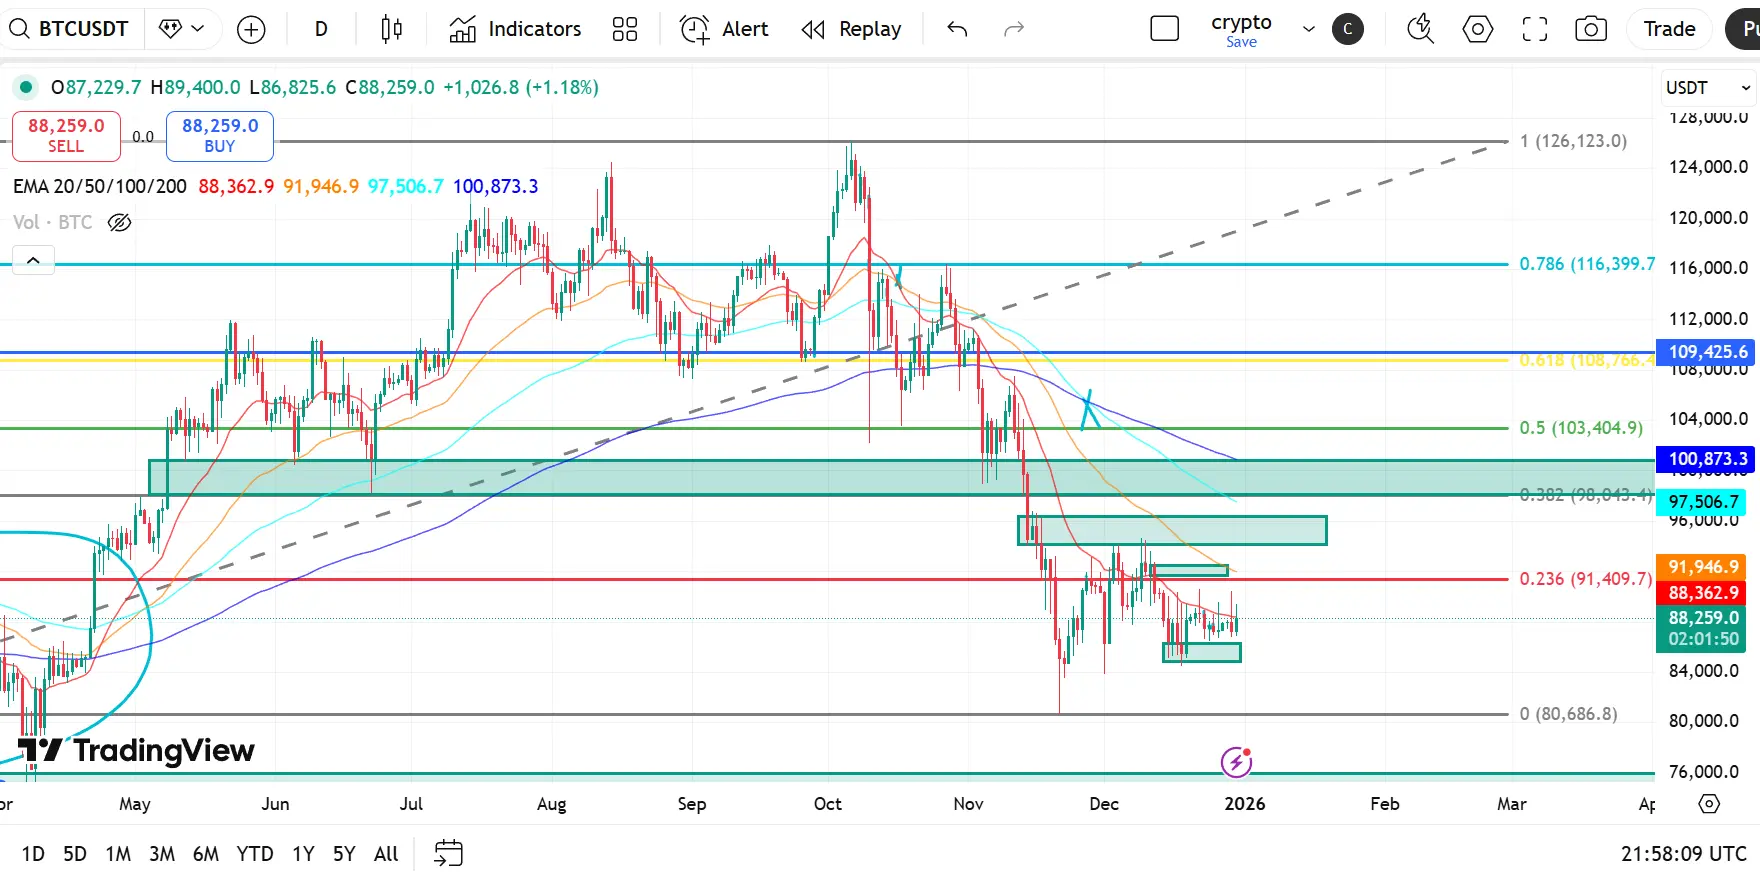
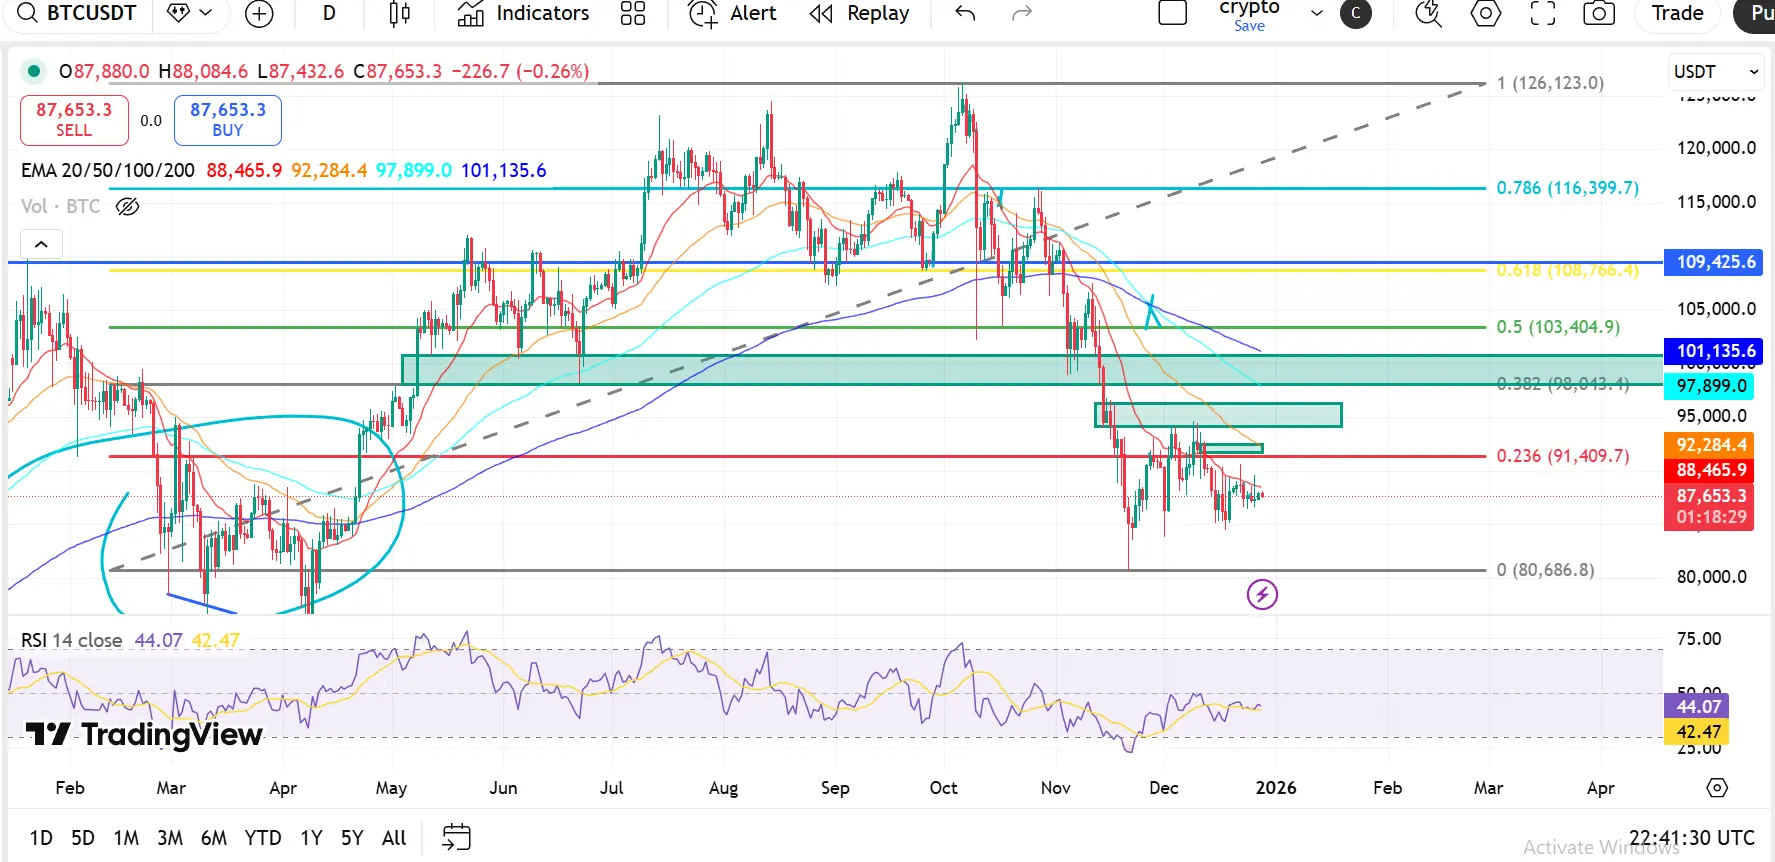
Triển vọng kỹ thuật BTC: Bitcoin ổn định gần mức cầu chính sau đợt giảm mạnh
Bitcoin vẫn nằm trong xu hướng giảm sau khi bị từ chối mạnh khỏi vùng cung $126K 116K–(macro, gần các mức Fibonacci 0.786–1.0. Khu vực này đánh dấu giai đoạn phân phối rõ ràng, sau đó BTC đã trải qua một đợt giảm giá mạnh.
Đà giảm tốc độ khi giá mất vùng )109.4K–$103.4K (0.618–0.5 Fib), biến một vùng hỗ trợ chính thành kháng cự và xác nhận sự thay đổi xu hướng rộng hơn.
Cấu trúc EMA (Thiên hướng giảm)
EMA 20 – $88,362
EMA 50 – $91,947
EMA 100 – $97,507
EMA 200 – $100,873
BTC đang giao dịch dưới tất cả các EMA chính, v
BTC0,69%
- Phần thưởng
- 25
- 11
- Đăng lại
- Retweed
MicroscopicVivi:
Năm mới, xu hướng mới, hiện tại chưa có nhiều biến động rõ ràng, nhưng xu hướng vẫn phù hợp để mở vị thế bán.Xem thêm
#Gate 2025 Year-End Community Gala#
Giải thưởng Streamer hàng đầu & Người sáng tạo nội dung cuối năm
Ai sẽ là Streamer hàng đầu của năm? Ai sẽ chiếm vị trí số 1 trên bảng xếp hạng Người sáng tạo nội dung? Tham gia bình chọn cùng tôi để ủng hộ các streamer và người sáng tạo yêu thích của bạn, và chứng kiến sự lên ngôi của các ngôi sao cộng đồng!
https://www.gate.com/activities/community-vote-2025?ref=BARCV1FY&refUid=13525639&ref_type=165&utm_cmp=xjdtmcgP
Xem bản gốcGiải thưởng Streamer hàng đầu & Người sáng tạo nội dung cuối năm
Ai sẽ là Streamer hàng đầu của năm? Ai sẽ chiếm vị trí số 1 trên bảng xếp hạng Người sáng tạo nội dung? Tham gia bình chọn cùng tôi để ủng hộ các streamer và người sáng tạo yêu thích của bạn, và chứng kiến sự lên ngôi của các ngôi sao cộng đồng!
https://www.gate.com/activities/community-vote-2025?ref=BARCV1FY&refUid=13525639&ref_type=165&utm_cmp=xjdtmcgP

- Phần thưởng
- 11
- 8
- Đăng lại
- Retweed
Ybaser:
Chúc mừng Giáng sinh ⛄Xem thêm
Hồi tưởng lại một năm trong lĩnh vực tiền điện tử—đón đầu các đỉnh cao của thị trường và thực hiện những bước nhảy táo bạo. Mỗi khoảnh khắc đều quan trọng. Kiểm tra #2025GateYearEndSummary của bạn ngay bây giờ, tổng kết hành trình crypto 2025 của bạn với Gate, và nhận 20 USDT bằng cách chia sẻ. https://www.gate.com/competition/your-year-in-review-2025?ref=BARCV1FY&ref_type=126&shareUid=VlJBV1xZAwoO0O0O
Xem bản gốc
- Phần thưởng
- 23
- 19
- 3
- Retweed
Marked119:
tuyệt vờiXem thêm
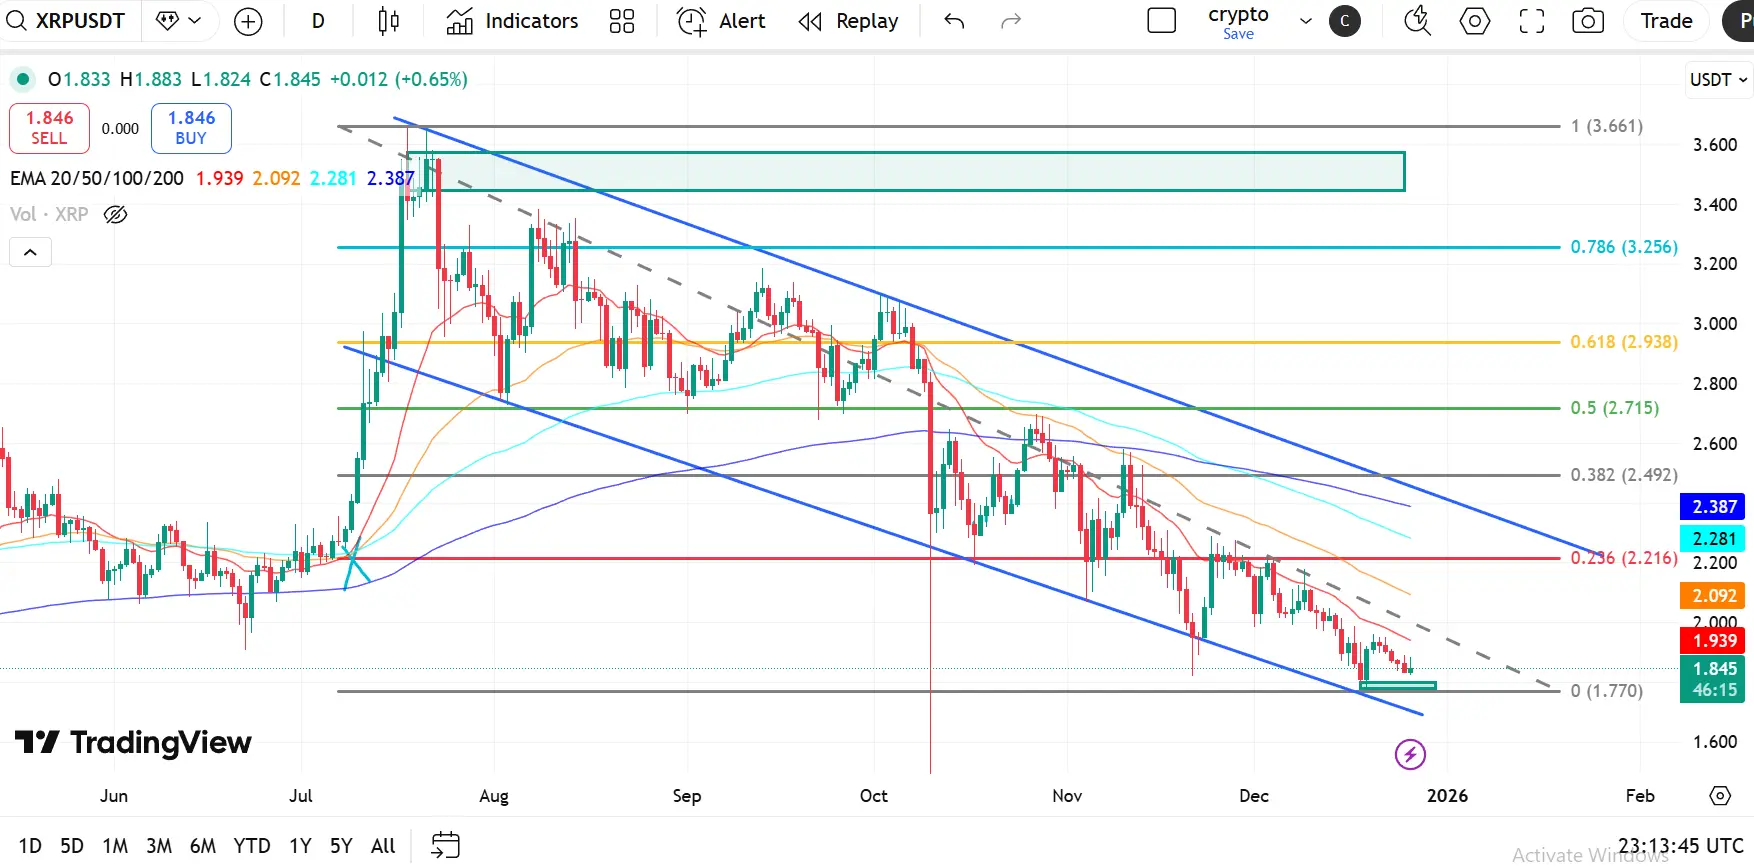
XRP Triển vọng kỹ thuật: Giá duy trì hỗ trợ kênh dưới trong khi xu hướng giảm vẫn tiếp diễn
XRP vẫn chịu áp lực giảm kéo dài, giao dịch trong một kênh giảm rõ ràng sau khi bị từ chối mạnh khỏi vùng cung vĩ mô $3.40–$3.65, gần mức Fib 1.0. Sự từ chối này đánh dấu đỉnh phân phối rõ ràng, kích hoạt xu hướng giảm kéo dài với các đỉnh thấp hơn liên tục.
Chuyển động giảm mạnh hơn khi XRP mất vùng (0.618–0.5 Fib) quanh khu vực $2.94–$2.71, biến vùng hỗ trợ quan trọng thành kháng cự và xác nhận yếu tố cấu trúc yếu.
Cấu trúc EMA (Thứ tự giảm)
EMA 20 – $1.92
EMA 50 – $2.06
EMA 100 – $2.26
EMA 200 – $2.3
XRP1,9%
- Phần thưởng
- 4
- 3
- Đăng lại
- Retweed
Szero:
Chuyến tăng giá Giáng Sinh! 🐂Xem thêm
Triển vọng kỹ thuật ETH: Ethereum duy trì vùng cầu vĩ mô khi cấu trúc giảm giá vẫn còn nguyên vẹn
Ethereum vẫn chịu áp lực điều chỉnh giảm, giao dịch dưới đường xu hướng vĩ mô bị phá vỡ và trong phạm vi phân phối rộng hơn. Sau một lần từ chối mạnh khỏi vùng cung $4,450–$4,950 (0.786–1 Fib), ETH bước vào xu hướng giảm kéo dài được đánh dấu bằng các đỉnh thấp hơn và đáy thấp hơn.
Chuyển động giảm gia tăng khi ETH mất vùng $4,060–$3,790 (0.618–0.5 Fib), biến một vùng hỗ trợ chính thành kháng cự và xác nhận yếu tố xu hướng.
Cấu trúc EMA (Thứ tự giảm)
EMA 20 – $2,983
EMA 50 – $3,132
EMA 100 – $3,34
ETH0,33%

- Phần thưởng
- 4
- 2
- Đăng lại
- Retweed
LittleGodOfWealthPlutus :
:
Cảm ơn bạn đã chia sẻ thông tinXem thêm
Hồi tưởng lại một năm trong lĩnh vực tiền điện tử—đón đầu các đỉnh cao của thị trường và thực hiện những bước nhảy táo bạo. Mỗi khoảnh khắc đều quan trọng. Kiểm tra #2025GateYearEndSummary của bạn ngay bây giờ, tổng kết hành trình crypto 2025 của bạn với Gate, và nhận 20 USDT bằng cách chia sẻ. https://www.gate.com/competition/your-year-in-review-2025?ref=BARCV1FY&ref_type=126&shareUid=VlJBV1xZAwoO0O0O
Xem bản gốc
- Phần thưởng
- 12
- 7
- Đăng lại
- Retweed
CryptoSpecto:
Chuyến tăng giá Giáng Sinh! 🐂Xem thêm
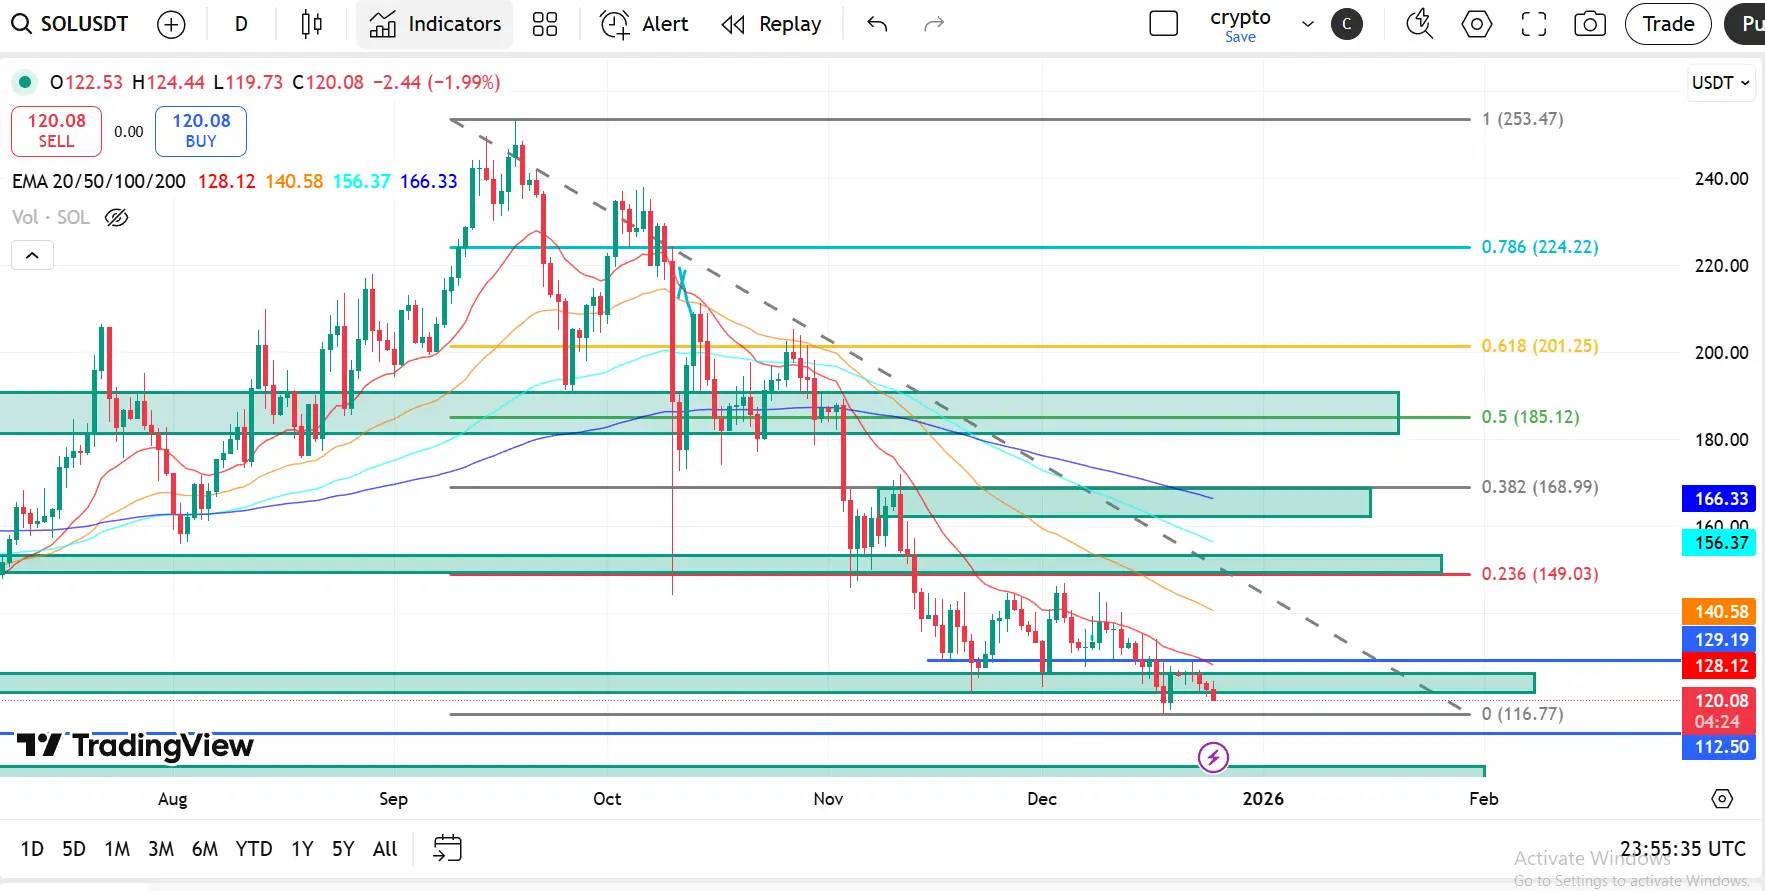
Dự báo kỹ thuật SOL: Solana duy trì vùng cầu chính khi áp lực giảm vẫn còn
Solana vẫn trong xu hướng điều chỉnh giảm rõ ràng, giao dịch dưới đường xu hướng giảm và tất cả các mức kháng cự Fibonacci chính. Sau khi phản ứng mạnh từ vùng cung $224–$250 , vùng cung (0.786–1 Fib), SOL đã tiếp tục tạo ra các đỉnh thấp hơn và đáy thấp hơn, xác nhận cấu trúc thị trường giảm giá.
Giá hiện đang ổn định gần mức hỗ trợ Fib 0 quanh $116–$120, một khu vực cầu mạnh lịch sử nơi áp lực bán bắt đầu giảm xuống.
Cấu trúc EMA (Thứ tự giảm giá)
EMA 20 – $126.9
EMA 50 – $138.2
EMA 100 – $153.9
EMA 200 – $164.7
SOL đ
SOL1,18%

- Phần thưởng
- 22
- 10
- 1
- Retweed
NewName:
Cảm ơn bạn vì thông tin!Xem thêm
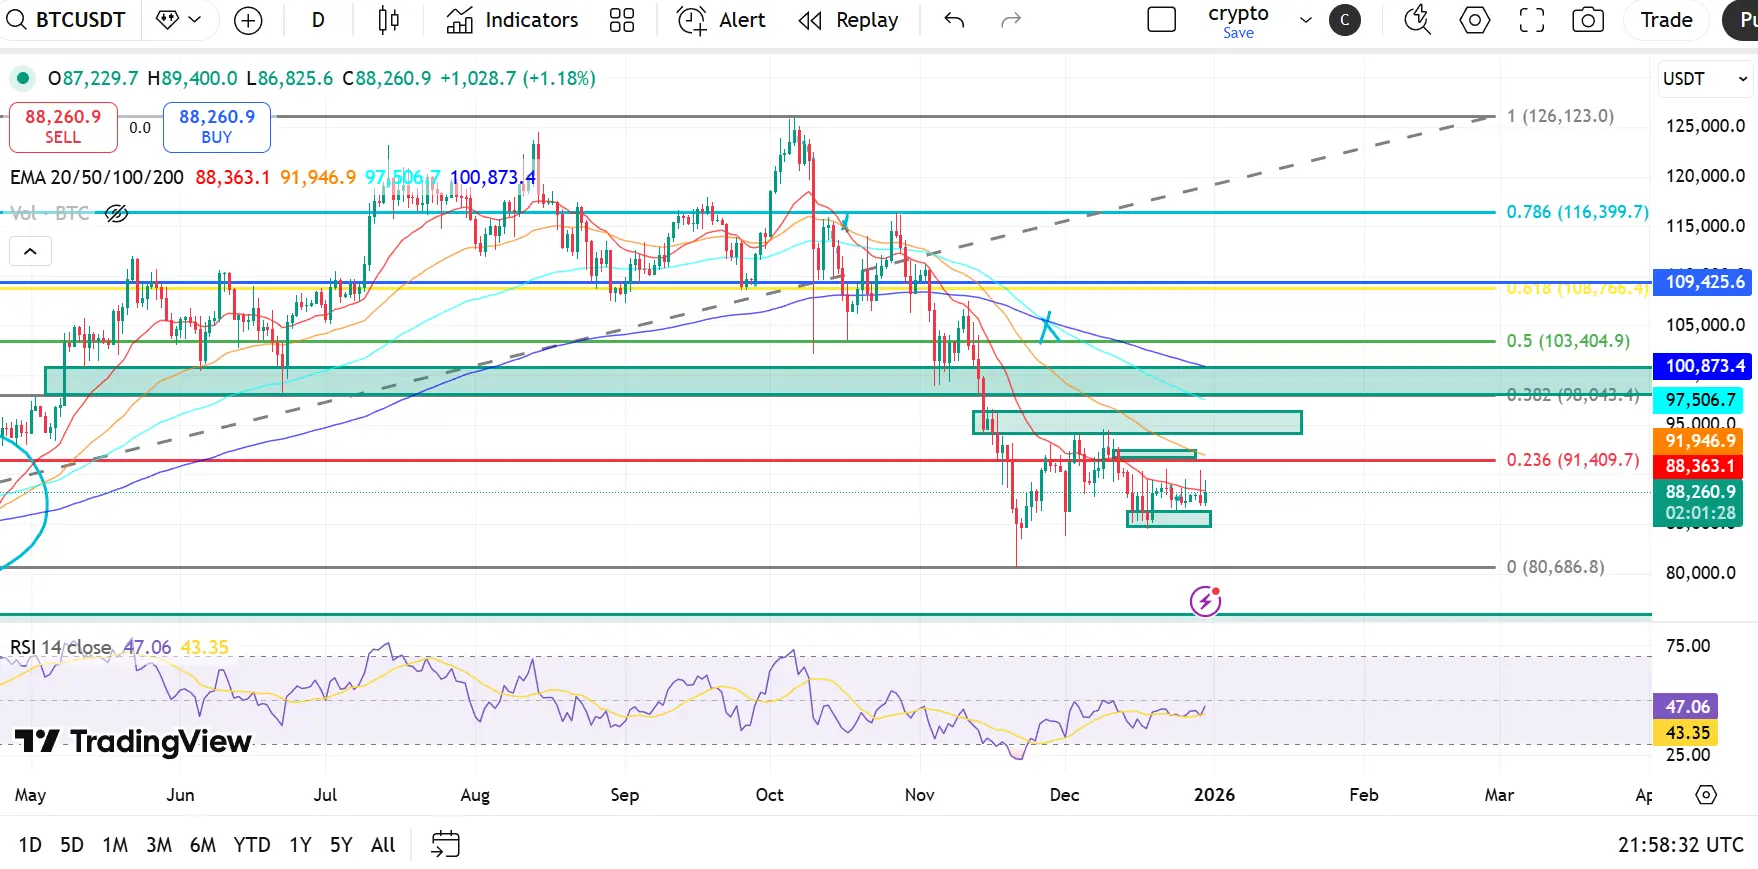
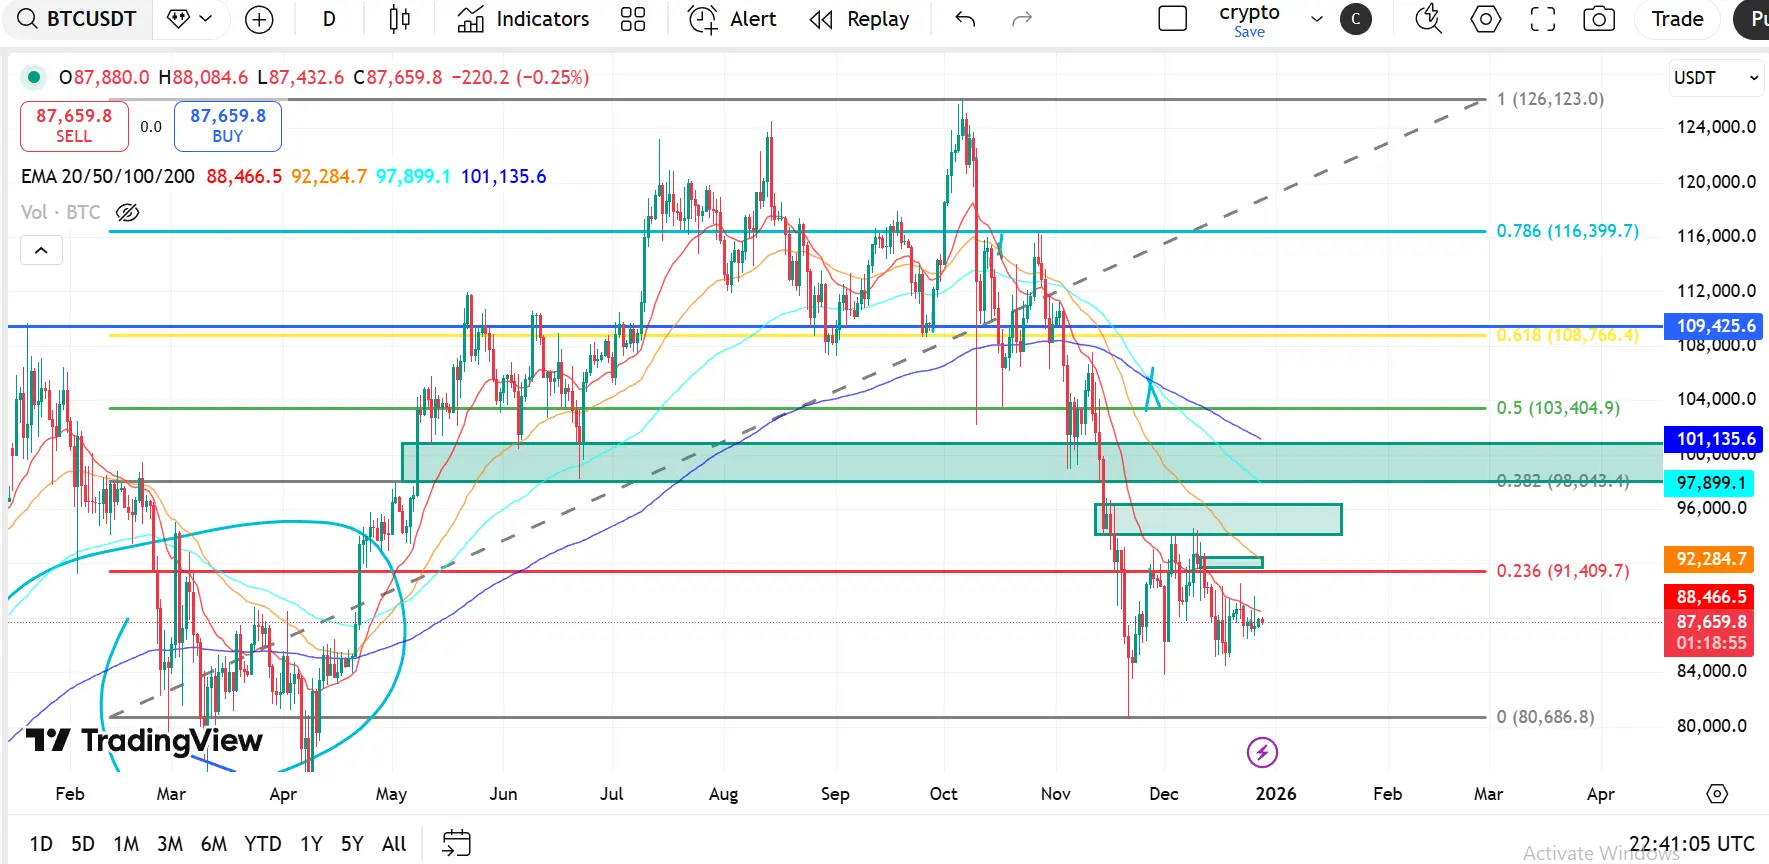
Triển vọng kỹ thuật BTC: Bitcoin tích lũy dưới các mức Fib chính khi cấu trúc giảm vẫn tiếp diễn
Bitcoin vẫn trong giai đoạn điều chỉnh, giao dịch dưới nhiều mức Fibonacci retracement chính sau khi bị từ chối mạnh từ vùng cung $116K–$120K 0.786 Fib(. Việc không giữ được trên vùng )0.618 Fib$109K cho thấy sự chuyển dịch rõ ràng từ xu hướng tăng tiếp tục sang phân phối và giảm giá.
Giá đã giảm mạnh và hiện đang tích lũy dưới mức 0.236 Fib, cho thấy kiểm soát giảm giá vẫn tiếp tục mặc dù đà giảm chậm lại.
Cấu trúc EMA (Thứ tự giảm)
EMA 20 – $88,466
EMA 50 – $92,284
EMA 100 – $97,899
EMA 200 – $1
SOL1,18%
- Phần thưởng
- 20
- 10
- Đăng lại
- Retweed
NewName:
Cảm ơn bạn vì thông tin!Xem thêm
Hồi tưởng lại một năm trong lĩnh vực tiền điện tử—đón đầu các đỉnh cao của thị trường và thực hiện những bước nhảy táo bạo. Mỗi khoảnh khắc đều quan trọng. Kiểm tra #2025GateYearEndSummary của bạn ngay bây giờ, tổng kết hành trình crypto 2025 của bạn với Gate, và nhận 20 USDT bằng cách chia sẻ. https://www.gate.com/competition/your-year-in-review-2025?ref=BARCV1FY&ref_type=126&shareUid=VlJBV1xZAwoO0O0O
Xem bản gốc
- Phần thưởng
- 14
- 9
- 1
- Retweed
Ybaser:
Chuyến tăng giá Giáng Sinh! 🐂Xem thêm
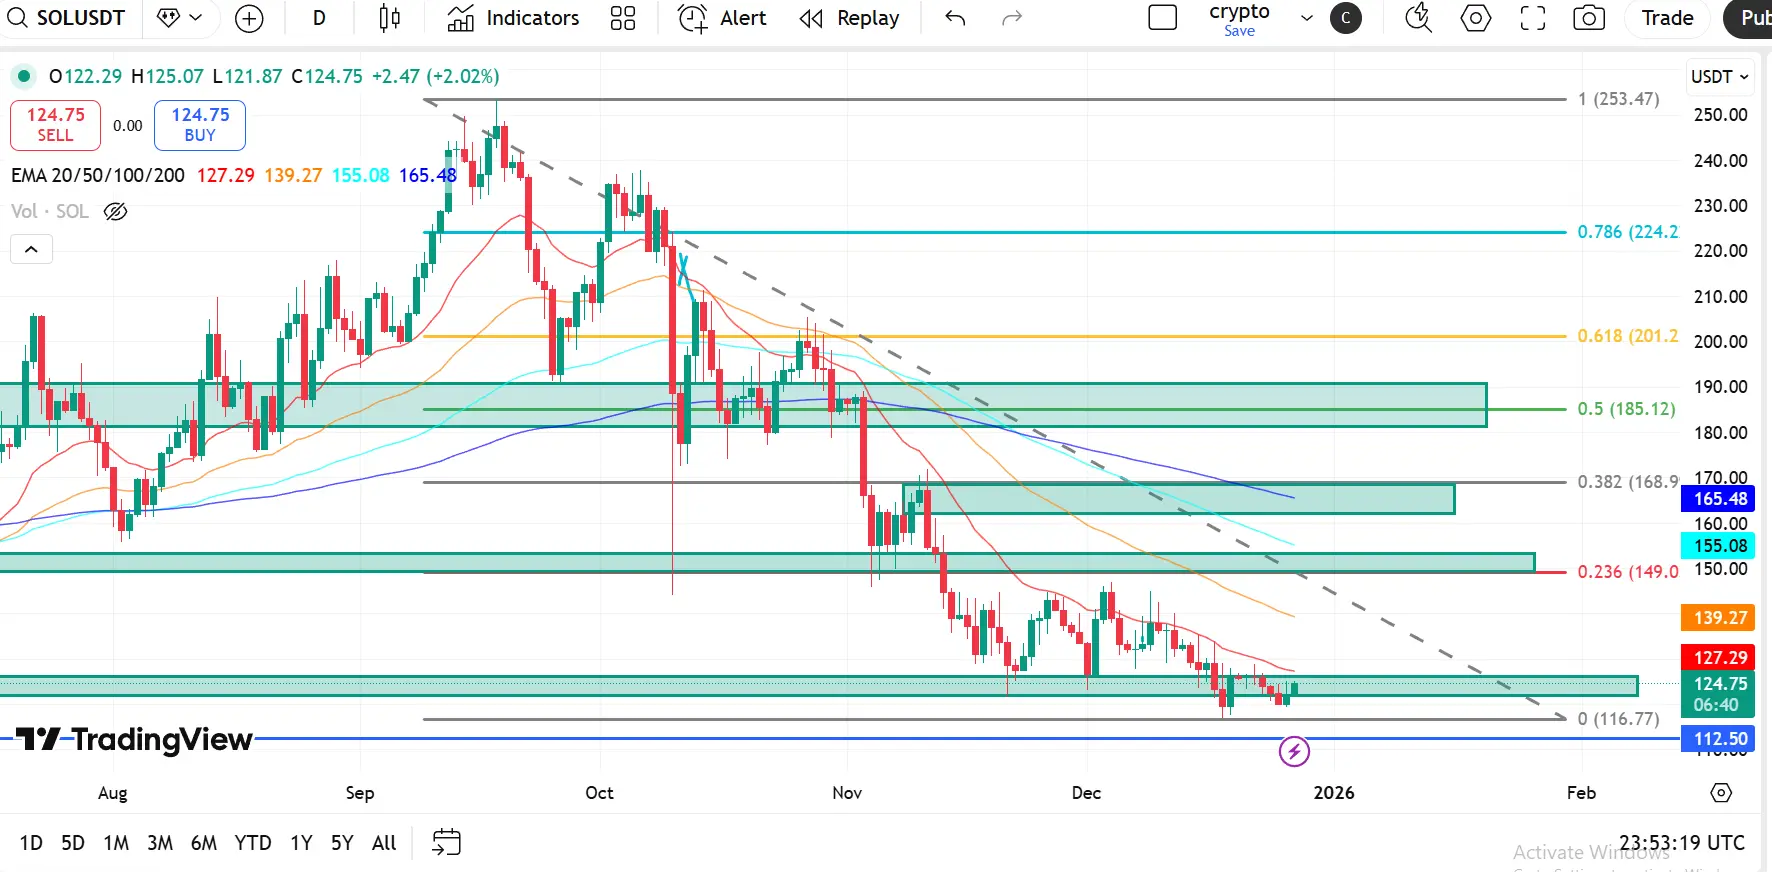
Triển vọng kỹ thuật SOL: Solana chịu áp lực giảm giá liên tục gần vùng cầu chính
Solana tiếp tục giao dịch trong xu hướng điều chỉnh mạnh, duy trì dưới các mức Fibonacci chính và các đường trung bình động lớn. Sau khi không thể lấy lại vùng cung $185–$190 , SOL đã trải qua một đợt giảm nữa và hiện đang tích lũy gần hỗ trợ dài hạn quan trọng.
Hành động giá cho thấy sự chiếm ưu thế của người bán, chỉ có một số dấu hiệu hạn chế của sự ổn định ngắn hạn.
Cấu trúc EMA (Giảm giá mạnh)
EMA 20 – $127.29
EMA 50 – $139.26
EMA 100 – $155.08
EMA 200 – $165.48
SOL đang giao dịch dưới tất cả các EMA chính, v
SOL1,18%
- Phần thưởng
- 17
- 10
- Đăng lại
- Retweed
MominurRahman990:
Cảm ơn bạn đã cung cấp thông tin.Xem thêm
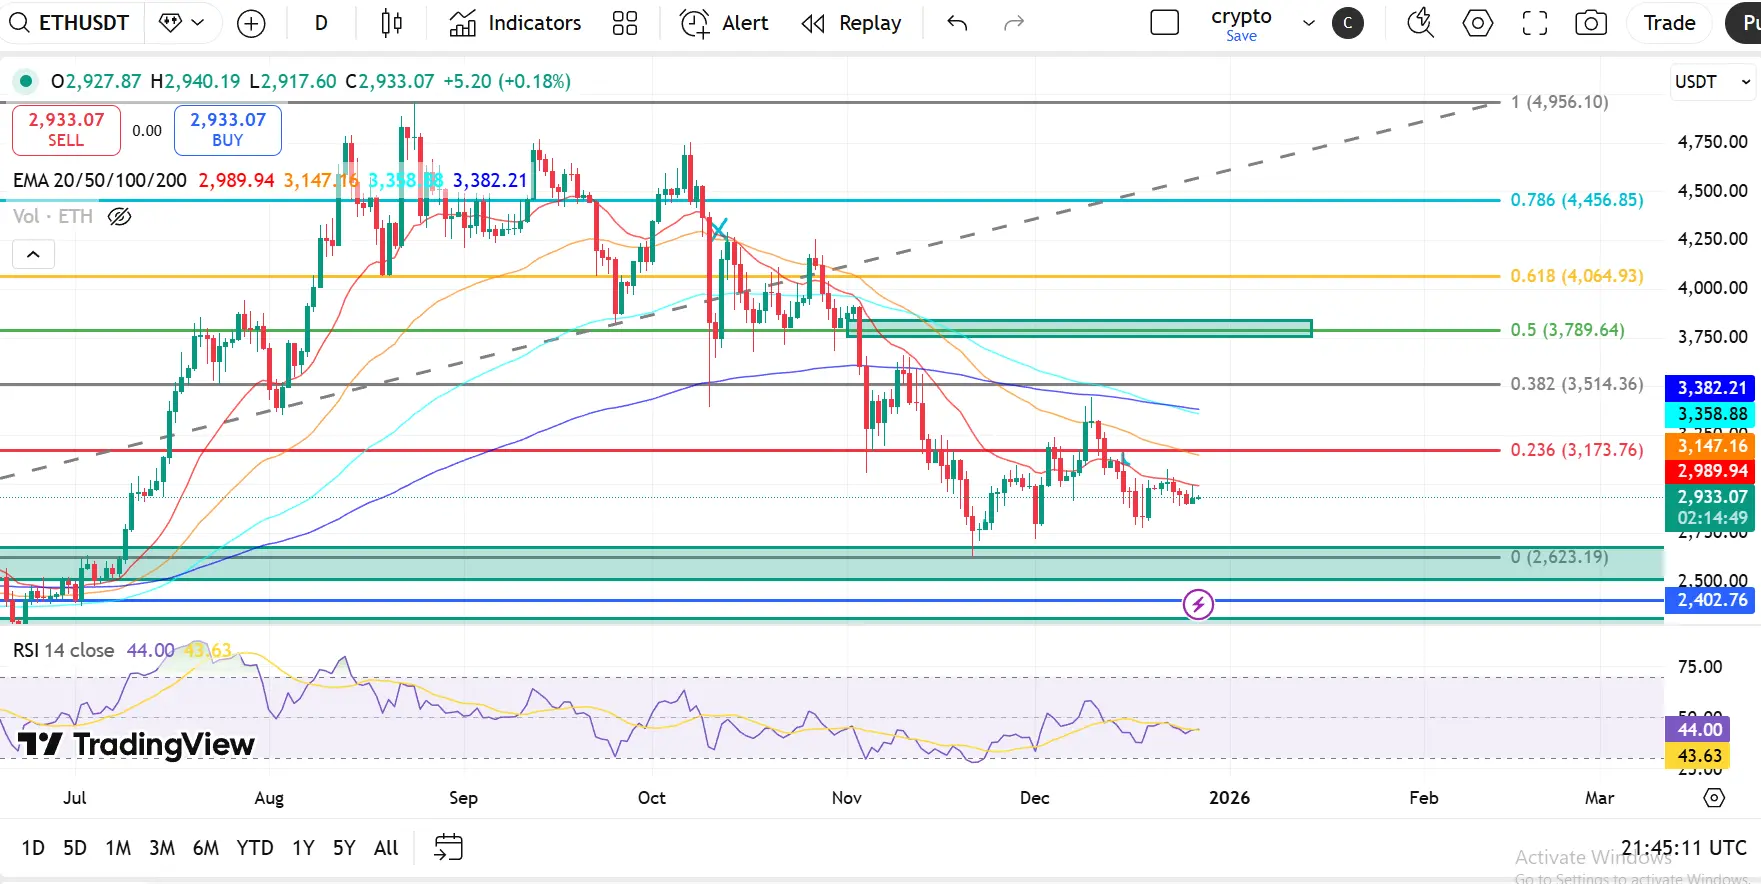
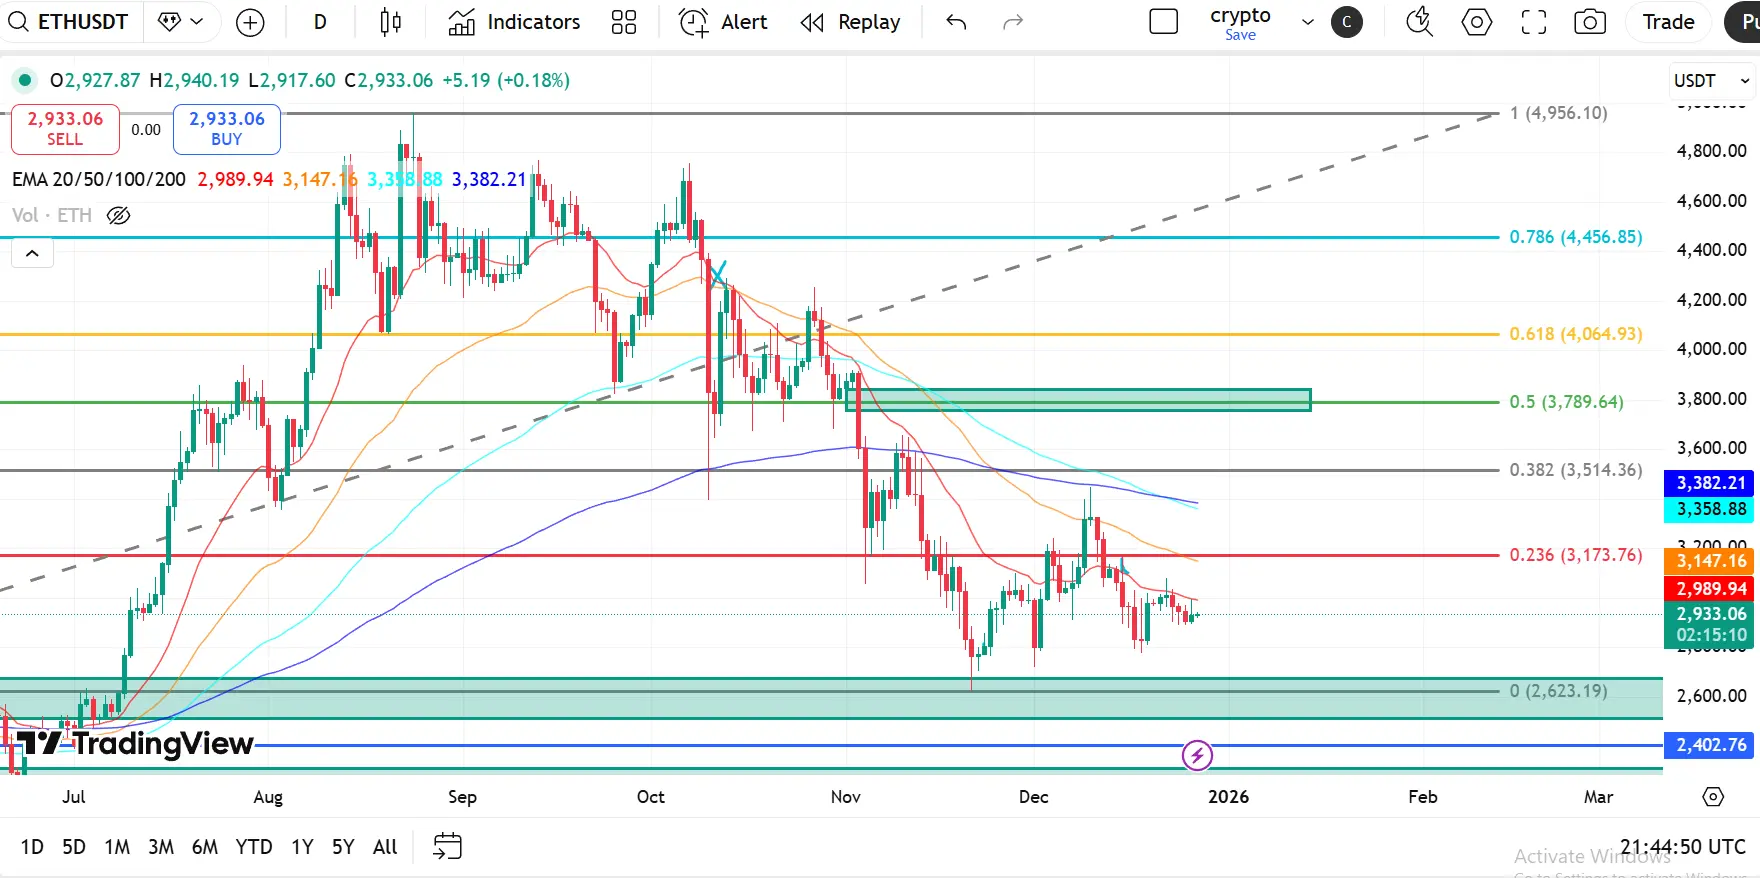
Triển vọng kỹ thuật ETH: Ethereum củng cố sau khi giảm xuống dưới mức hỗ trợ Fibonacci chính
Ethereum vẫn chịu áp lực điều chỉnh sau khi không giữ được trên vùng $3,780–$3,800 (0.5 Fib). Sự từ chối khỏi mức này đánh dấu một sự chuyển hướng rõ ràng của xu hướng, theo sau là một đợt bán tháo mạnh đẩy ETH xuống dưới nhiều mức Fibonacci chính và các đường trung bình động lớn.
Giá hiện đang củng cố gần vùng $2,900–$3,000, hình thành một nền tảng ngắn hạn sau đợt giảm giá gần đây.
Cấu trúc EMA (Thứ tự giảm giá)
EMA 20 – $2,989
EMA 50 – $3,147
EMA 100 – $3,359
EMA 200 – $3,382
ETH đang giao dịch dưới
ETH0,33%
- Phần thưởng
- 22
- 15
- Đăng lại
- Retweed
KatyPaty:
Chúc mừng Giáng sinh ⛄Xem thêm
Hồi tưởng lại một năm trong lĩnh vực tiền điện tử—đón đầu các đỉnh cao của thị trường và thực hiện những bước nhảy táo bạo. Mỗi khoảnh khắc đều quan trọng. Kiểm tra #2025GateYearEndSummary của bạn ngay bây giờ, tổng kết hành trình crypto 2025 của bạn với Gate, và nhận 20 USDT bằng cách chia sẻ. https://www.gate.com/competition/your-year-in-review-2025?ref=BARCV1FY&ref_type=126&shareUid=VlJBV1xZAwoO0O0O
Xem bản gốc
- Phần thưởng
- 11
- 9
- 1
- Retweed
Ybaser:
Chuyến tăng giá Giáng Sinh! 🐂Xem thêm
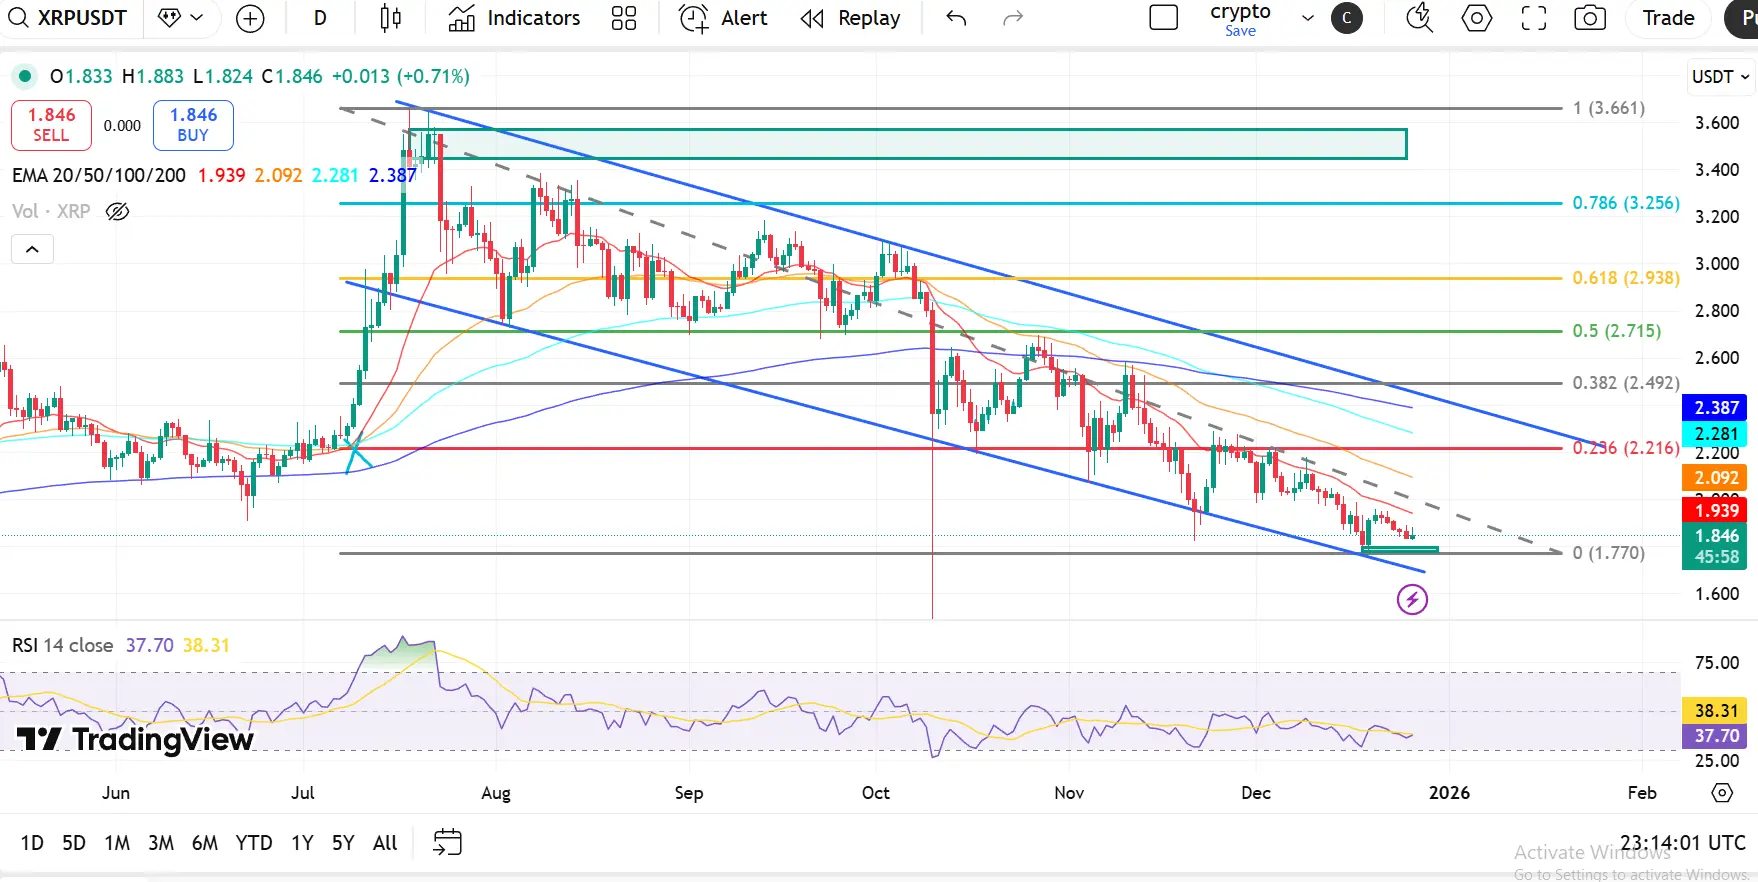
Triển vọng kỹ thuật XRP: Ripple giữ mức hỗ trợ chính khi áp lực giảm vẫn tiếp diễn
XRP hiện đang giao dịch gần vùng hỗ trợ quan trọng quanh mức $1.77–$1.85, phù hợp với mức Fib 0 ($1.77) và giới hạn dưới của kênh giảm dài hạn. Người mua đang cố gắng bảo vệ vùng này sau một đợt giảm giá kéo dài nhiều tháng theo sau sự từ chối mạnh mẽ từ vùng cung $3.25–$3.65.
Việc bán tháo gia tăng khi XRP mất các mức Fib 0.382 ($2.49) và 0.236 ($2.21), xác nhận sự chiếm ưu thế của người bán kéo dài. Giá hiện đang giao dịch dưới tất cả các đường trung bình động EMA chính, củng cố cấu trúc giảm giá:
EMA 20 – $1.
XRP1,9%
- Phần thưởng
- 14
- 8
- Đăng lại
- Retweed
GateUser-1c8a1331:
Chuyến tăng giá Giáng Sinh! 🐂Xem thêm
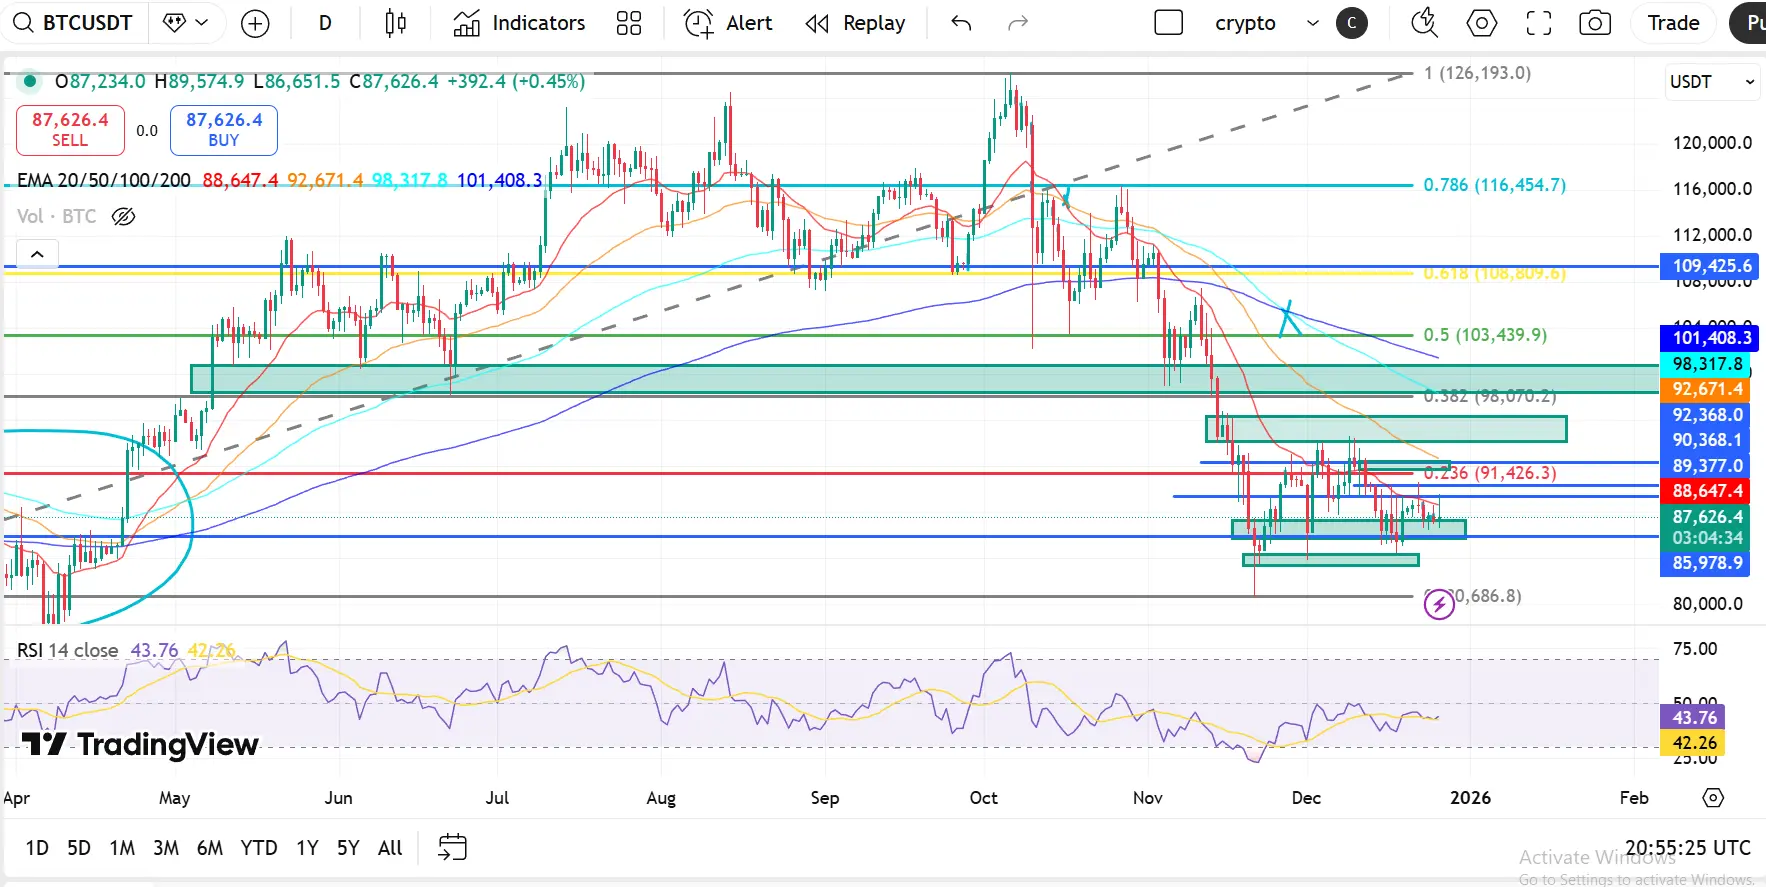
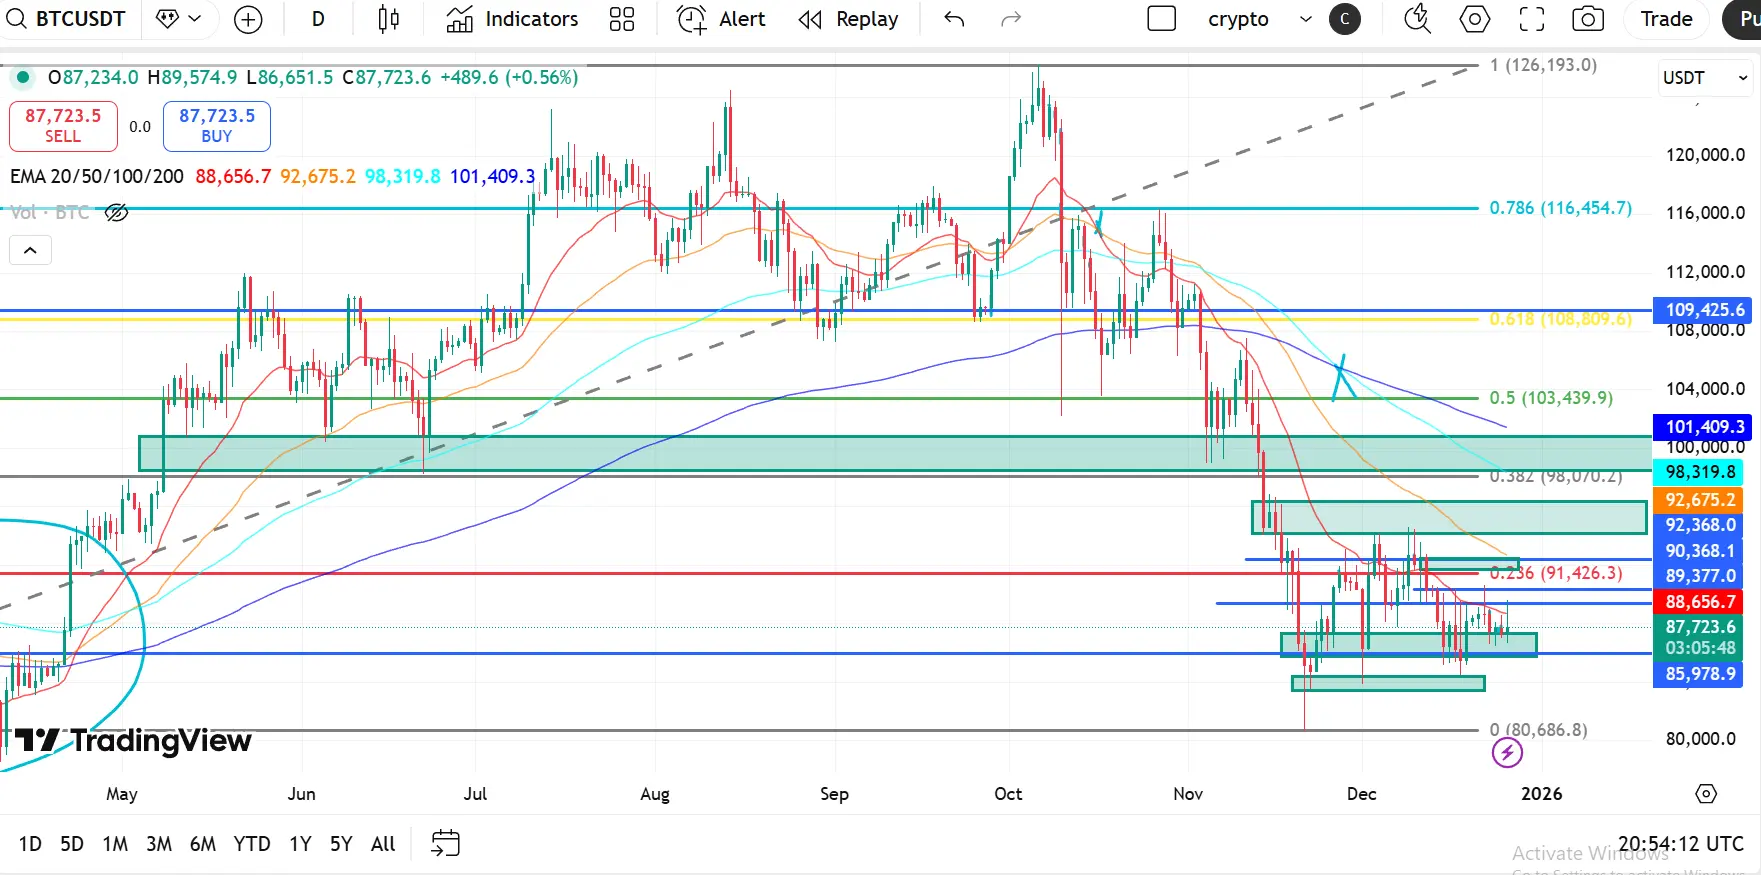
Triển vọng kỹ thuật BTC: Bitcoin tích lũy dưới các mức Fib chính sau đợt giảm mạnh
Bitcoin vẫn chịu áp lực điều chỉnh sau khi không duy trì được trên vùng kháng cự $109K–$112K , phù hợp với mức thoái lui Fibonacci 0.618 (~$109,400). Sự từ chối từ phạm vi trên cùng và sự giảm xuống dưới đường xu hướng tăng đã làm thay đổi cấu trúc thị trường từ tăng giá sang trung tính-giảm trong trung hạn.
Giá hiện đang tích lũy gần vùng $86K–$88K , hình thành nền tảng ngắn hạn sau đợt bán tháo mạnh từ đỉnh trên $120K+.
Cấu trúc EMA (Thiên hướng giảm sang trung tính)
EMA 20 – $88,648
EMA 50 – $92,672
EMA 100 –
BTC0,69%
- Phần thưởng
- 20
- 10
- 1
- Retweed
AnnaCryptoWriter :
:
Chúc mừng Giáng sinh 🎄🎁.Xem thêm
Hồi tưởng lại một năm trong lĩnh vực tiền điện tử—đón đầu các đỉnh cao của thị trường và thực hiện những bước nhảy táo bạo. Mỗi khoảnh khắc đều quan trọng. Kiểm tra #2025GateYearEndSummary của bạn ngay bây giờ, tổng kết hành trình crypto 2025 của bạn với Gate, và nhận 20 USDT bằng cách chia sẻ. https://www.gate.com/competition/your-year-in-review-2025?ref=BARCV1FY&ref_type=126&shareUid=VlJBV1xZAwoO0O0O
Xem bản gốc
- Phần thưởng
- 9
- 9
- Đăng lại
- Retweed
Ybaser:
Giáng sinh lên Mặt Trăng! 🌕Xem thêm
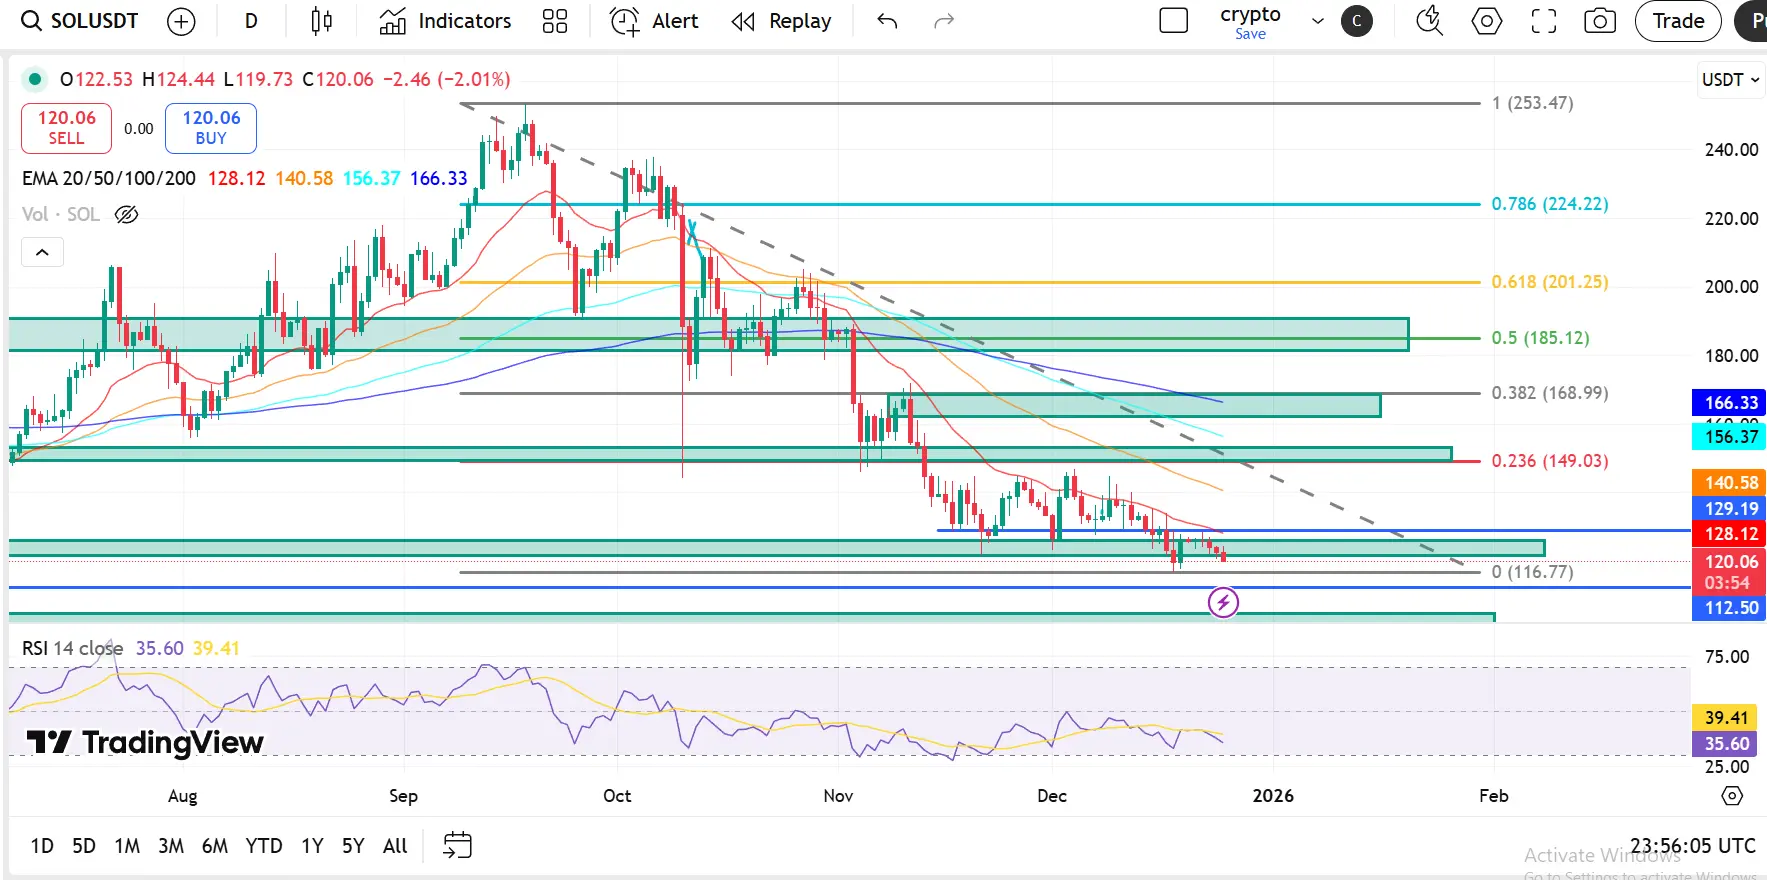
Triển vọng kỹ thuật của SOL: Solana duy trì vùng cầu chính khi xu hướng giảm vẫn còn nguyên
Solana tiếp tục giao dịch dưới áp lực giảm giá, di chuyển trong một đường xu hướng giảm rõ ràng sau khi đạt đỉnh gần vùng cung $250 245–(, phù hợp với mức Fib 1.0 )$253$201 . Sự từ chối này đánh dấu sự kết thúc của xu hướng tăng trước đó và bắt đầu một đợt điều chỉnh kéo dài.
Áp lực bán gia tăng sau khi SOL mất các mức ()0.618 Fib$185 và ()0.5 Fib(, cả hai đều từng đóng vai trò hỗ trợ mạnh mẽ và giờ đã chuyển thành kháng cự.
Cấu trúc EMA )Thứ tự giảm giá$149
EMA 20 – $128.12
EMA 50 – $140.58
EMA 100 –
SOL1,18%
- Phần thưởng
- 13
- 6
- Đăng lại
- Retweed
MominurRahman990:
Cảm ơn bạn đã cung cấp thông tin.Xem thêm