2025 ARPA Price Prediction: Analyzing Market Trends, Network Development, and Potential Growth Factors in the Blockchain Privacy Sector
Introduction: ARPA's Market Position and Investment Value
ARPA (ARPA), as a flexible and highly compatible computing network, has made significant strides in providing privacy computing protocol layers for mainstream public chains since its inception. As of 2025, ARPA's market capitalization has reached $20,920,319, with a circulating supply of approximately 982,174,603 tokens, and a price hovering around $0.0213. This asset, known as the "privacy computing enabler," is playing an increasingly crucial role in fields such as financial transactions, credit investigation, marketing, and healthcare.
This article will comprehensively analyze ARPA's price trends from 2025 to 2030, considering historical patterns, market supply and demand, ecosystem development, and macroeconomic factors to provide professional price predictions and practical investment strategies for investors.
I. ARPA Price History Review and Current Market Status
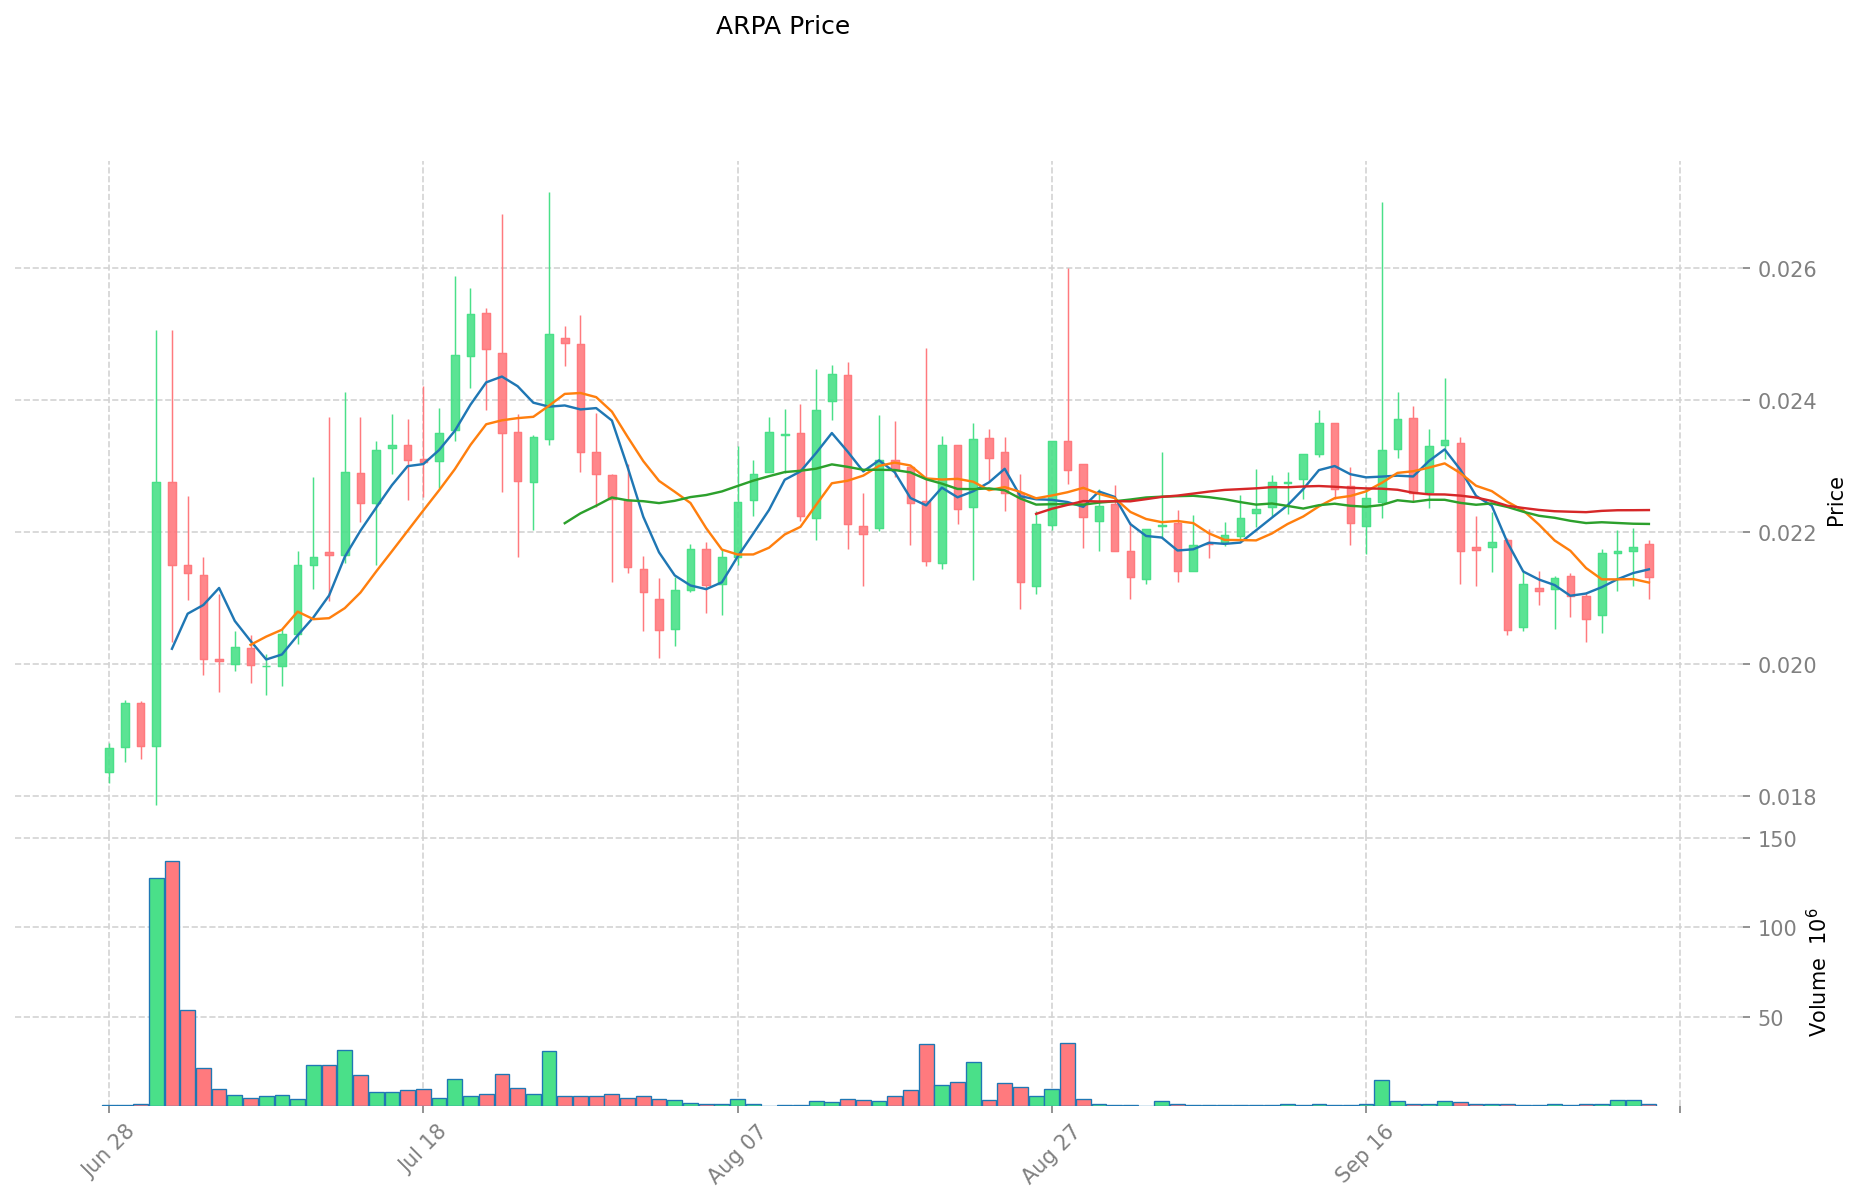
ARPA Historical Price Evolution Trajectory
- 2020: ARPA reached its all-time low of $0.00339441 on March 13, during the global market crash
- 2021: ARPA hit its all-time high of $0.268622 on November 3, amid the broader cryptocurrency bull market
- 2024-2025: ARPA experienced a significant price decline, dropping 46.07% over the past year
ARPA Current Market Situation
As of October 5, 2025, ARPA is trading at $0.0213, with a 24-hour trading volume of $25,839.45. The token has seen a slight decrease of 0.79% in the last 24 hours. ARPA's current market capitalization stands at $20,920,319.05, ranking it at 1075th position in the global cryptocurrency market.
The token's price is currently 92.07% below its all-time high and 527.30% above its all-time low. In the short term, ARPA has shown mixed performance, with a 0.47% increase in the last hour and a 1.09% gain over the past week. However, it has experienced a 1.53% decrease in the last 30 days.
ARPA's fully diluted market cap is $42,600,000.00, with a circulating supply of 982,174,603.29 ARPA tokens, representing 49.11% of the total supply of 2,000,000,000 tokens.
Click to view the current ARPA market price
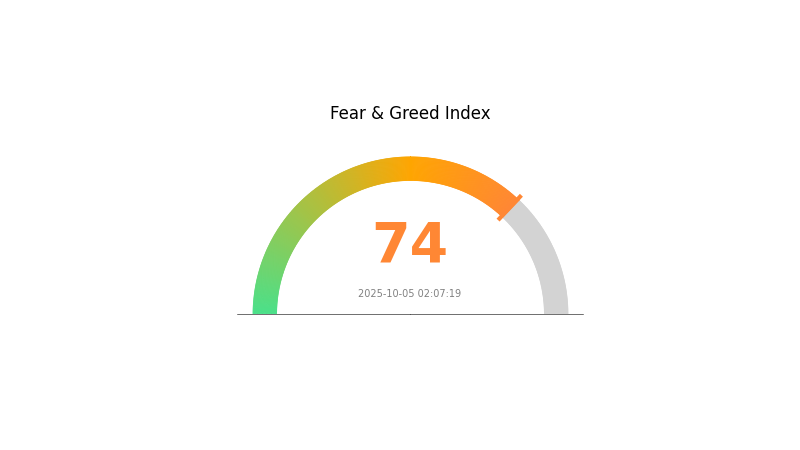
ARPA Market Sentiment Indicator
2025-10-05 Fear and Greed Index: 74 (Greed)
Click to view the current Fear & Greed Index
The crypto market is showing signs of excessive optimism, with the Fear and Greed Index reaching 74, indicating a state of greed. This suggests that investors are becoming increasingly bullish, potentially driving up asset prices. However, such high levels of greed often precede market corrections. Traders should exercise caution and consider taking profits or implementing risk management strategies. It's crucial to remember that market sentiment can shift rapidly, and maintaining a balanced approach is key to navigating these volatile conditions.
ARPA Holdings Distribution
The address holdings distribution data provides insights into the concentration of ARPA tokens among different wallet addresses. Analysis of this data reveals a relatively high concentration of ARPA tokens among the top holders. The top 5 addresses collectively control 46.45% of the total ARPA supply, with the largest holder possessing 11.16% of the tokens.
This level of concentration suggests a potential for market volatility and susceptibility to large holder movements. The top two addresses each hold over 10% of the supply, which could significantly impact market dynamics if these holdings were to be moved or sold. However, it's worth noting that 53.55% of the tokens are distributed among other addresses, indicating a degree of decentralization beyond the top holders.
The current distribution structure implies a moderate level of centralization, which may affect market stability and price movements. While this concentration allows for quicker decision-making in governance, it also poses risks of potential market manipulation by large holders. Investors and traders should monitor these top addresses for any significant changes in holdings that could signal market shifts.
Click to view the current ARPA Holdings Distribution
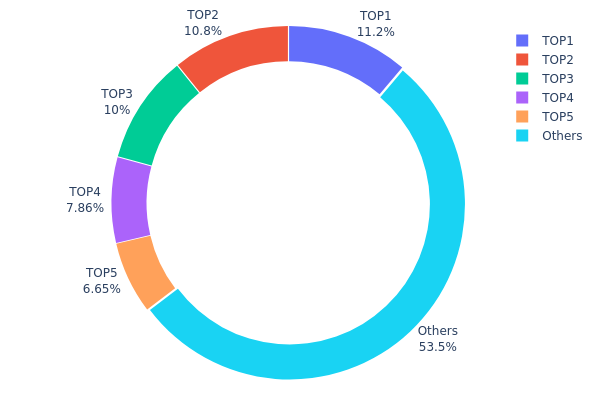
| Top | Address | Holding Qty | Holding (%) |
|---|---|---|---|
| 1 | 0x5ec0...f8d3ab | 223302.29K | 11.16% |
| 2 | 0x28c6...f21d60 | 216076.54K | 10.80% |
| 3 | 0x5a52...70efcb | 200000.00K | 10.00% |
| 4 | 0x1681...5b4f65 | 157111.11K | 7.85% |
| 5 | 0x76ec...78fbd3 | 132996.96K | 6.64% |
| - | Others | 1070513.11K | 53.55% |
II. Key Factors Affecting ARPA's Future Price
Supply Mechanism
- Historical patterns: Past supply changes have influenced price movements
- Current impact: Expected effects of the current supply changes
Macroeconomic Environment
- Impact of monetary policies: Expectations of major central bank policies
- Inflation hedging properties: Performance in inflationary environments
Technological Development and Ecosystem Building
- Ecosystem applications: Key DApps/ecosystem projects
III. ARPA Price Prediction for 2025-2030
2025 Outlook
- Conservative forecast: $0.01342 - $0.0213
- Neutral forecast: $0.0213 - $0.0229
- Optimistic forecast: $0.0229 - $0.0245 (requires positive market sentiment)
2027-2028 Outlook
- Market phase expectation: Potential growth phase
- Price range forecast:
- 2027: $0.0244 - $0.02694
- 2028: $0.0144 - $0.02906
- Key catalysts: Increasing adoption and technological advancements
2029-2030 Long-term Outlook
- Base scenario: $0.02762 - $0.03010 (assuming steady market growth)
- Optimistic scenario: $0.03259 - $0.04215 (assuming strong market performance)
- Transformative scenario: $0.04215+ (with exceptional project developments and market conditions)
- 2030-12-31: ARPA $0.0301 (potential year-end average)
| 年份 | 预测最高价 | 预测平均价格 | 预测最低价 | 涨跌幅 |
|---|---|---|---|---|
| 2025 | 0.0245 | 0.0213 | 0.01342 | 0 |
| 2026 | 0.02793 | 0.0229 | 0.01832 | 7 |
| 2027 | 0.02694 | 0.02542 | 0.0244 | 19 |
| 2028 | 0.02906 | 0.02618 | 0.0144 | 22 |
| 2029 | 0.03259 | 0.02762 | 0.01685 | 29 |
| 2030 | 0.04215 | 0.0301 | 0.0286 | 41 |
IV. ARPA Professional Investment Strategies and Risk Management
ARPA Investment Methodology
(1) Long-term Holding Strategy
- Suitable for: Long-term value investors
- Operation suggestions:
- Accumulate ARPA tokens during market dips
- Set price targets and review holdings periodically
- Store tokens securely in non-custodial wallets
(2) Active Trading Strategy
- Technical analysis tools:
- Moving Averages: Use for trend identification and support/resistance levels
- RSI (Relative Strength Index): Identify overbought/oversold conditions
- Key points for swing trading:
- Monitor market sentiment and news catalysts
- Set strict stop-loss and take-profit levels
ARPA Risk Management Framework
(1) Asset Allocation Principles
- Conservative investors: 1-3% of crypto portfolio
- Aggressive investors: 5-10% of crypto portfolio
- Professional investors: 10-15% of crypto portfolio
(2) Risk Hedging Solutions
- Diversification: Spread investments across multiple crypto assets
- Stop-loss orders: Implement to limit potential losses
(3) Secure Storage Solutions
- Hot wallet recommendation: Gate Web3 wallet
- Cold storage solution: Hardware wallet for long-term holdings
- Security precautions: Use two-factor authentication, backup private keys securely
V. Potential Risks and Challenges for ARPA
ARPA Market Risks
- Volatility: Cryptocurrency market's inherent price fluctuations
- Liquidity: Potential challenges in large-volume trading
- Competition: Emerging privacy-focused blockchain projects
ARPA Regulatory Risks
- Regulatory uncertainty: Evolving global cryptocurrency regulations
- Compliance requirements: Potential impact on ARPA's operations
- Cross-border restrictions: Limitations on international usage
ARPA Technical Risks
- Smart contract vulnerabilities: Potential for exploitation
- Scalability challenges: Network congestion during high demand
- Technological obsolescence: Rapid advancements in blockchain technology
VI. Conclusion and Action Recommendations
ARPA Investment Value Assessment
ARPA presents a unique value proposition in privacy computing but faces short-term market volatility and regulatory uncertainties. Long-term potential exists if adoption increases and technological development continues.
ARPA Investment Recommendations
✅ Beginners: Start with small positions, focus on understanding the technology ✅ Experienced investors: Consider dollar-cost averaging and set clear exit strategies ✅ Institutional investors: Conduct thorough due diligence and consider OTC trading for large positions
ARPA Trading Participation Methods
- Spot trading: Available on Gate.com and other supported exchanges
- Staking: Participate in available staking programs for passive income
- DeFi integration: Explore decentralized finance protocols supporting ARPA
Cryptocurrency investments carry extremely high risks, and this article does not constitute investment advice. Investors should make decisions carefully based on their own risk tolerance and are advised to consult professional financial advisors. Never invest more than you can afford to lose.
FAQ
Does Arpa Crypto have a future?
Yes, ARPA has a promising future. Technical analysis suggests a bullish outlook, supported by strong fundamentals and potential for growth in the Web3 ecosystem.
What is the price prediction for ADA 2025?
Cardano (ADA) is projected to reach an average price of $0.945 by 2025, representing a potential 79% return on investment from current levels.
What is the price of ARPA stock?
ARPA is not a stock but a cryptocurrency. Its price is $0.0216 as of October 5, 2025, showing a slight decrease recently.
What is Arpa coin used for?
Arpa coin is used for computation services, incentivizing node operators, and enabling participation in the network's governance and operations.
Share
Content