2025 DPrice Tahmini: Dijital varlık değerlemelerine yönelik piyasa trendlerinin ve geleceğe dair öngörülerin analizi


Giriş: D’nin Pazar Konumu ve Yatırım Potansiyeli
Dar Open Network (D), yapay zekâ destekli, zincirden bağımsız Web3 uygulamaları için altyapı sunan bir platform olarak, kuruluşundan bu yana ortak teknolojiler, varlıklar ve token kullanımına imkân sağlamaktadır. 2025 itibarıyla D’nin piyasa değeri 19.959.524 $’a, dolaşımdaki arzı yaklaşık 643.025.918 tokene ve fiyatı 0,03104 $ seviyesine ulaşmıştır. “Web3 kolaylaştırıcısı” olarak bilinen bu varlık, merkeziyetsiz uygulamalar, yönetişim, staking ve pazar yerlerinde giderek daha belirleyici bir rol üstlenmektedir.
Bu makalede, 2025-2030 yılları arasında D’nin fiyat hareketleri, geçmiş eğilimler, piyasa arz-talep dengesi, ekosistem gelişimi ve makroekonomik faktörler ışığında incelenerek yatırımcılara profesyonel fiyat tahminleri ve uygulanabilir yatırım stratejileri sunulacaktır.
I. D Fiyat Geçmişi ve Güncel Piyasa Durumu
D’nin Tarihsel Fiyat Seyri
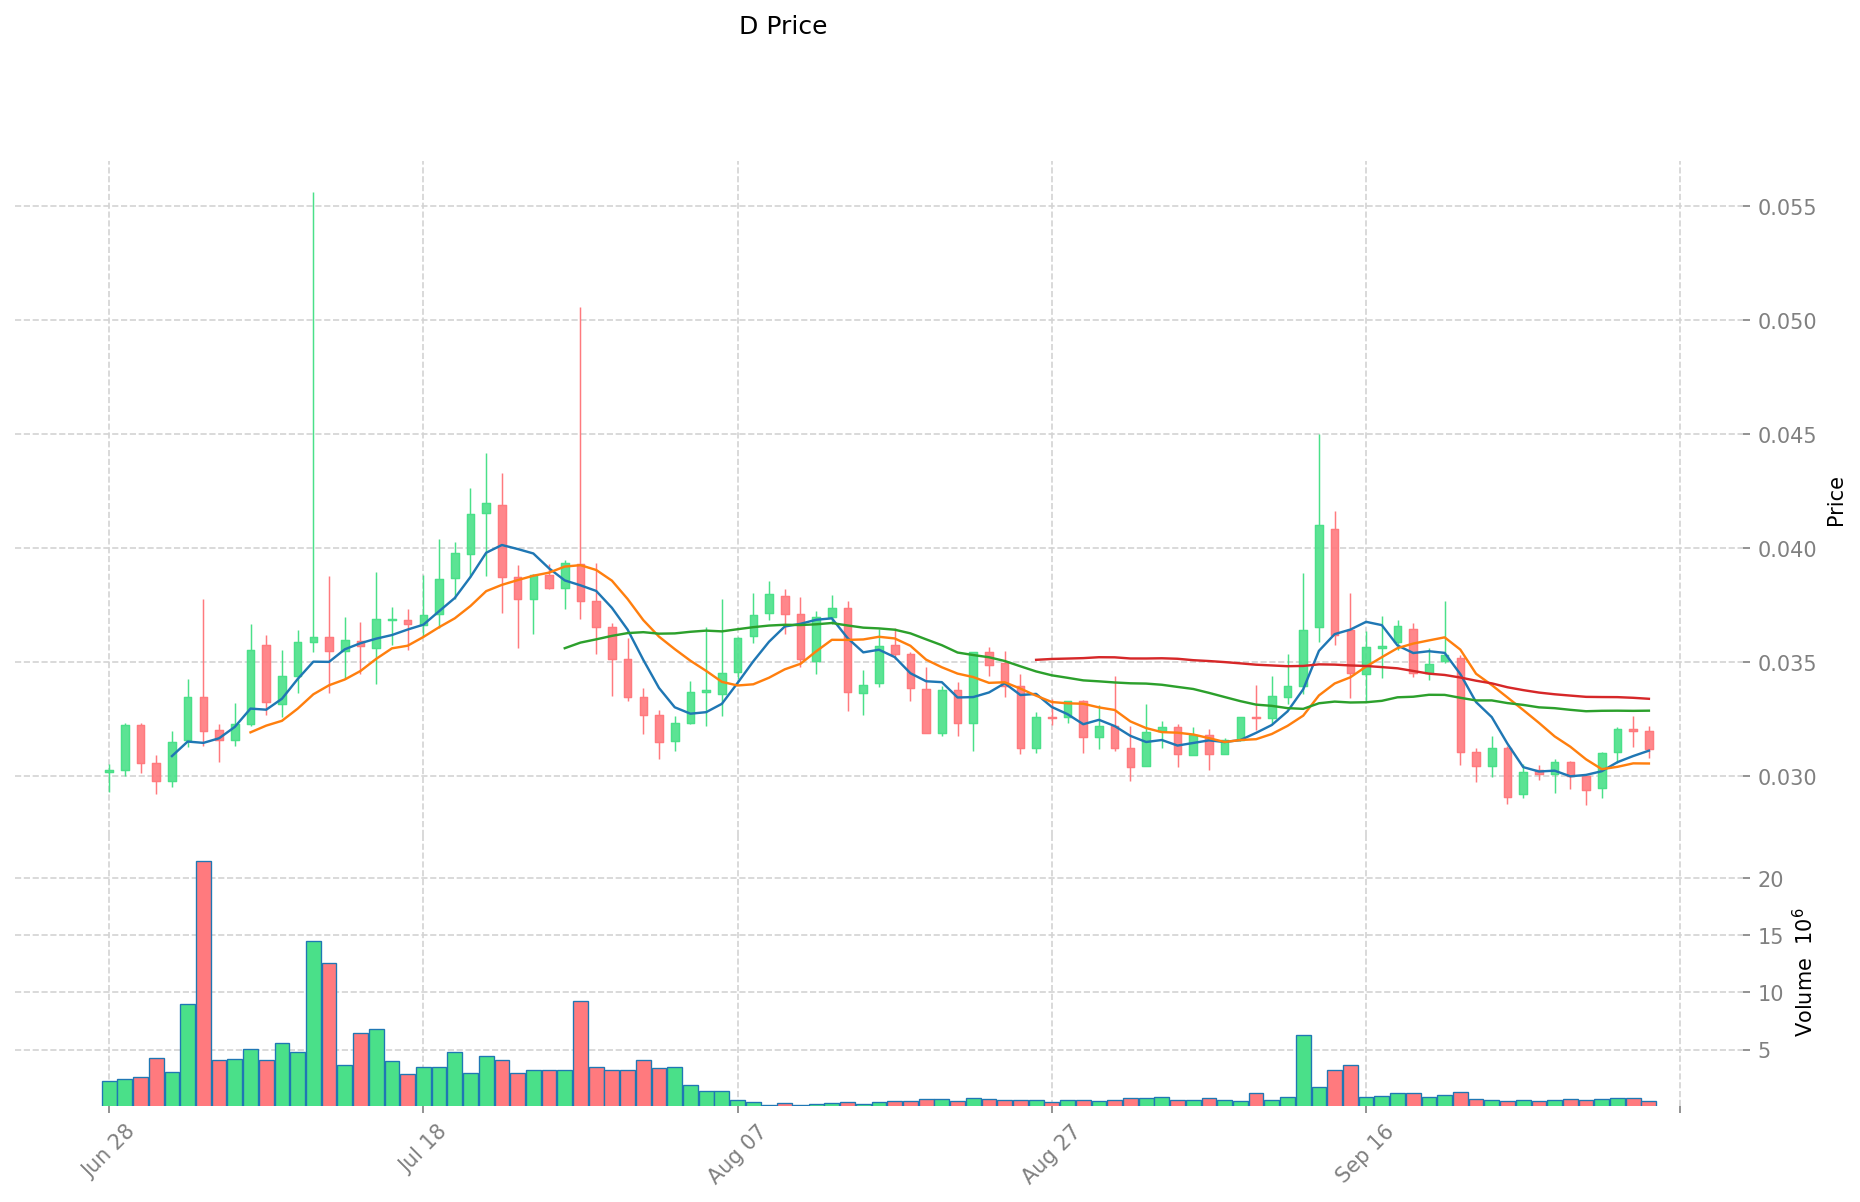
- 2025 (Ocak): D, 0,203222 $ ile tüm zamanların en yüksek seviyesine ulaşarak proje açısından kritik bir dönüm noktası yaşadı.
- 2025 (Haziran): Token sert bir değer kaybı ile 0,02636371 $’a, yani tüm zamanların en düşük seviyesine indi.
- 2025 (Ekim): D, toparlanma işaretleri göstererek fiyatını 0,03104 $ seviyesine taşıdı.
D Güncel Piyasa Görünümü
05 Ekim 2025 tarihinde D, 0,03104 $ seviyesinde işlem görüyor ve 24 saatlik işlem hacmi 15.897,29 $’dır. Son 24 saatte token %2,26 oranında değer kaybetmiştir. D’nin piyasa değeri 19.959.524 $ olup kripto para piyasasında 1.105’inci sıradadır. Mevcut fiyat, tüm zamanların zirvesine göre %78,84’lük bir düşüşe işaret ederek son bir yılda ciddi bir piyasa düzeltmesi yaşandığını göstermektedir. Bununla birlikte, kısa vadede %4,16’lık artışla olumlu bir ivme kazanmıştır. Dolaşımdaki arz 643.025.918 token olup, bu rakam toplam arzın %80,38’ine (800.000.000) karşılık gelmektedir. Tam seyreltilmiş piyasa değeri ise 24.832.000 $’dır.
D Piyasa Duyarlılık Göstergesi
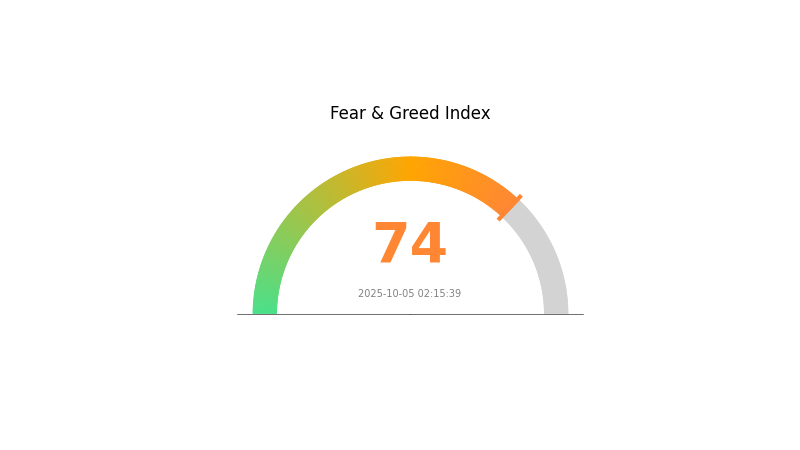
05 Ekim 2025 Korku ve Açgözlülük Endeksi: 74 (Açgözlülük)
Güncel Korku & Açgözlülük Endeksi için tıklayın
Kripto piyasasında açgözlülük hâkim ve Korku-Açgözlülük Endeksi 74 seviyesinde. Yatırımcılar oldukça iyimser ve özgüvenli. Olumlu piyasa hissiyatı fiyatları yukarı taşıyabilir; ancak temkinli olmak gerekir. Aşırı açgözlülük genellikle piyasa düzeltmesinin habercisidir. Yatırımcılar kâr almalı veya pozisyonlarını hedge etmeyi düşünmelidir. Başarılı yatırım çoğu zaman kalabalığın tersine hareket etmeyi gerektirir. Dikkatli olun ve FOMO’nun kararlarınızı etkilemesine izin vermeyin.
D Varlık Dağılımı
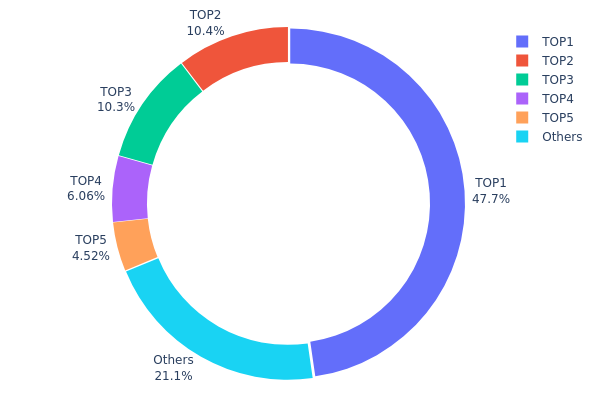
Adres bazlı varlık dağılımı, D tokenlarının cüzdanlar arasında ne kadar yoğunlaştığı konusunda temel veriler sunar. Analiz, en büyük adresin toplam arzın %47,71’ini, yani 190.841,89K tokenı elinde bulundurduğunu ve dağılımın son derece merkezi olduğunu gösteriyor. İlk beş adres, toplam D tokenlarının %78,9’unu kontrol ediyor ve bu, mülkiyetin aşırı yoğunlaştığını gösteriyor.
Bu yoğunlaşma, piyasa manipülasyonu ve fiyat oynaklığı riskini artırıyor. Tokenların neredeyse yarısı tek bir cüzdanda olduğunda, büyük ölçekli hareketler piyasayı ciddi biçimde etkileyebilir. İkinci ve üçüncü en büyük sahiplerin arzın %10’undan fazlasını elinde bulundurması da bu riski artırıyor. Merkezileşmiş bu yapı fiyat istikrarsızlığına yol açabilir ve merkeziyetsizlik ilkesine olan güveni zayıflatabilir.
Piyasa yapısı açısından bakıldığında, tokenın kullanıcılar ve yatırımcılar arasında yeterince yayılmadığı görülüyor. Tokenların %21,1’i “Diğerleri” arasında olsa da, birkaç adresin büyük kontrolü yaygın benimsemenin sınırlı olduğuna işaret ediyor. Bu merkezileşme, tokenın piyasa şoklarına dayanıklılığını ve çeşitli paydaşlardan oluşan sağlıklı bir ekosistemi koruma kabiliyetini etkileyebilir.
Güncel D Varlık Dağılımı için tıklayın
| En Üst | Adres | Varlık Miktarı | Varlık (%) |
|---|---|---|---|
| 1 | 0xf977...41acec | 190.841,89K | 47,71% |
| 2 | 0xf015...0611c0 | 41.504,72K | 10,37% |
| 3 | 0x32cc...c6ce2e | 41.028,34K | 10,25% |
| 4 | 0xae57...a47c9e | 24.242,65K | 6,06% |
| 5 | 0x4863...d959f5 | 18.071,59K | 4,51% |
| - | Diğerleri | 84.310,81K | 21,1% |
II. D’nin Gelecek Fiyatını Belirleyen Temel Etkenler
Arz Mekanizması
- Merkez Bankası Alımları: 2022’den bu yana küresel merkez bankaları yıllık net 1.000 tonun üzerinde altın alıyor.
- Tarihsel Eğilimler: Merkez bankası altın alımlarının yoğun olduğu dönemlerde, altın fiyatlarında yükseliş yaşanmıştır.
- Güncel Etki: Merkez bankalarının devam eden alımları, altın fiyatlarını kısa vadede güçlü biçimde destekleyecektir.
Kurumsal ve Büyük Sahip Dinamikleri
- Kurumsal Varlıklar: Altın ETF’lerine 2025 başından bu yana 473 ton net giriş oldu.
- Kurumsal Benimseme: Teknoloji ve havacılık şirketleri üretimde altın kullanımını artırıyor.
- Ulusal Politikalar: Birçok ülke “dolarizasyonu azaltma” politikası izleyerek ekonomik risklere karşı altın rezervlerini artırıyor.
Makroekonomik Ortam
- Para Politikası Etkisi: Fed dâhil küresel merkez bankaları gevşek para politikalarına geçerek faiz indirimleriyle altın fiyatlarını destekliyor.
- Enflasyon Koruma Özellikleri: Altın, mevcut ekonomik belirsizlikte enflasyona karşı güvenli liman olma özelliğini koruyor.
- Jeopolitik Faktörler: Süregiden jeopolitik gerilimler altının güvenli varlık olarak cazibesini artırıyor.
Teknolojik Gelişmeler ve Ekosistem Oluşumu
- Finansal Yenilik: Altın destekli ETF’ler ve finansal ürünler altının piyasada erişimini ve likiditesini artırdı.
- Sektörel Uygulamalar: Elektronik, savunma, havacılık ve tıp gibi sektörler altına olan endüstriyel talebi büyütüyor.
III. 2025-2030 D Fiyat Tahmini
2025 Görünümü
- Temkinli tahmin: 0,01583 $ - 0,02500 $
- Tarafsız tahmin: 0,02500 $ - 0,03103 $
- İyimser tahmin: 0,03103 $ - 0,03786 $ (olumlu piyasa hissiyatı ve artan benimseme ile)
2027-2028 Görünümü
- Piyasa fazı tahmini: Artan dalgalanma ile büyüme dönemi
- Fiyat aralığı öngörüsü:
- 2027: 0,02296 $ - 0,05449 $
- 2028: 0,03923 $ - 0,04857 $
- Temel katalizörler: Teknolojik yenilikler, yaygın piyasa kabulü ve düzenleyici netlik
2030 Uzun Vadeli Görünüm
- Temel senaryo: 0,04000 $ - 0,05097 $ (istikrarlı büyüme ve benimseme ile)
- İyimser senaryo: 0,05097 $ - 0,07442 $ (olumlu piyasa koşulları ve artan kullanım ile)
- Dönüştürücü senaryo: 0,07442 $ - 0,09000 $ (çığır açan kullanım alanları ve ana akım benimseme ile)
- 31 Aralık 2030: D 0,07442 $ (yılın olası zirve fiyatı)
| Yıl | Tahmini En Yüksek Fiyat | Tahmini Ortalama Fiyat | Tahmini En Düşük Fiyat | Fiyat Değişim Oranı |
|---|---|---|---|---|
| 2025 | 0,03786 | 0,03103 | 0,01583 | 0 |
| 2026 | 0,0434 | 0,03444 | 0,03031 | 10 |
| 2027 | 0,05449 | 0,03892 | 0,02296 | 25 |
| 2028 | 0,04857 | 0,04671 | 0,03923 | 50 |
| 2029 | 0,05431 | 0,04764 | 0,02573 | 53 |
| 2030 | 0,07442 | 0,05097 | 0,03109 | 64 |
IV. D Profesyonel Yatırım Stratejileri ve Risk Yönetimi
D Yatırım Metodolojisi
(1) Uzun Vadeli Tutma Stratejisi
- Uygun yatırımcı: Uzun vadeli değer yatırımcıları ve Web3 altyapısına inananlar
- İşlem önerileri:
- Piyasa düşüşlerinde D token biriktirin
- Staking ile yönetişime katılın ve ödül kazanın
- Tokenlarınızı güvenli, saklama dışı cüzdanlarda saklayın
(2) Aktif Al-Sat Stratejisi
- Teknik analiz araçları:
- Hareketli Ortalama: Trendleri ve dönüş noktalarını tespit edin
- RSI: Aşırı alım ve satım sinyallerini izleyin
- Swing trade için önemli noktalar:
- Zarar durdur emri ile riski yönetin
- Belirlenen direnç seviyelerinde kâr alın
D Risk Yönetimi Çerçevesi
(1) Varlık Dağılımı Prensipleri
- Temkinli yatırımcılar: Kripto portföyünün %1-3’ü
- Agresif yatırımcılar: %5-10
- Profesyonel yatırımcılar: %15’e kadar
(2) Riskten Korunma Çözümleri
- Çeşitlendirme: Farklı Web3 ve AI projelerine yatırım yapın
- Zarar durdur: Kayıpları sınırlamak için uygulayın
(3) Güvenli Saklama Çözümleri
- Sıcak cüzdan önerisi: Gate Web3 cüzdanı
- Soğuk saklama: Donanım cüzdanı ile uzun vadeli tutum
- Güvenlik: İki faktörlü doğrulama, güçlü şifre ve düzenli yazılım güncellemesi kullanın
V. D’nin Potansiyel Riskleri ve Zorlukları
D Piyasa Riskleri
- Yüksek oynaklık: Kripto piyasasında sık rastlanan sert fiyat dalgalanmaları
- Rekabet: Yeni Web3 ve AI projeleri D’nin pazardaki yerini tehdit edebilir
- Likidite riski: Düşük işlem hacmi, pozisyonların açılıp kapatılmasını zorlaştırabilir
D Düzenleyici Riskler
- Belirsiz mevzuat: Web3 ve AI projeleri için artan denetim olasılığı
- Sınır ötesi uyumluluk: Farklı ülkelerde değişen regülasyonlar benimsemeyi sınırlayabilir
- Token sınıflandırması: D bazı bölgelerde menkul kıymet olarak değerlendirilebilir
D Teknik Riskler
- Akıllı sözleşme açıkları: Kodda oluşabilecek güvenlik zaafları veya hatalar
- Ölçeklenebilirlik: Ağ yükünde kapasite sorunları yaşanabilir
- Birlikte çalışabilirlik: Farklı blokzincir ekosistemleriyle entegrasyon sorunları
VI. Sonuç ve Eylem Önerileri
D Yatırım Değeri Değerlendirmesi
D, yapay zekâ destekli ve zincirden bağımsız Web3 altyapısıyla benzersiz bir değer sunar. Dijital ekosistemde uzun vadeli potansiyeli güçlü olsa da, yatırımcılar kısa vadeli oynaklık ve projenin erken aşamasına dikkat etmelidir.
D Yatırım Önerileri
✅ Yeni başlayanlar: Küçük, düzenli yatırımlarla pozisyonunuzu zamanla oluşturun ✅ Deneyimli yatırımcılar: Risk ve piyasa analizine göre orta seviyede tahsisat değerlendirin ✅ Kurumsal yatırımcılar: D’yi çeşitlendirilmiş Web3 ve AI portföyünde değerlendirin
D İşlem Katılım Yöntemleri
- Spot al-sat: Gate.com’da D token alın ve tutun
- Staking: Yönetişime katılın, ödül kazanın
- DeFi entegrasyonu: D token ile merkeziyetsiz finans fırsatlarını keşfedin
Kripto para yatırımları çok yüksek risk taşır; bu makale yatırım tavsiyesi değildir. Yatırımcılar kendi risk profillerine göre dikkatli karar vermeli ve profesyonel danışmana başvurmalıdır. Asla kaybetmeyi göze alabileceğinizden fazlasını yatırmayın.
Sıkça Sorulan Sorular
2025 için D-Wave tahmini nedir?
Mevcut verilere göre, D-Wave (QBTS) hissesi 2025’in bir sonraki ayında %0,53 artış gösterecek (05 Ekim 2025 itibarıyla).
D için hedef fiyat nedir?
D için hedef fiyat 58,00 $ ile 63,00 $ arasında; ortalama 60,50 $ (05 Ekim 2025).
2025 için Dow hisse fiyatı tahmini nedir?
Mevcut piyasa analizine göre Dow hissesi 2025’te 20,26 $ ile 24,29 $ arasında dalgalanacak ve mevcut seviyelerde istikrar gösterecek.
2030’da Dai için fiyat tahmini nedir?
Mevcut analizlere göre Dai’nin fiyatı 2030’da ₹113,20’ye ulaşacak; bu, 2025 seviyesine göre %5 fiyat değişimi varsayımıyla hesaplanmıştır.
Share
Content
Giriş: D’nin Pazar Konumu ve Yatırım Potansiyeli
I. D Fiyat Geçmişi ve Güncel Piyasa Durumu
II. D’nin Gelecek Fiyatını Belirleyen Temel Etkenler
III. 2025-2030 D Fiyat Tahmini
IV. D Profesyonel Yatırım Stratejileri ve Risk Yönetimi
V. D’nin Potansiyel Riskleri ve Zorlukları
VI. Sonuç ve Eylem Önerileri
Sıkça Sorulan Sorular
How to Buy Cryptocurrency


Trending Cryptocurrencies


Kuantum Finansal Sistemi: Bankacılıktaki Zaman Çizelgesi ve Uygulama

Proje Omega: Elon Musk'ın Kripto Girişimi 2025'te Açıklandı

Mira Kripto: Nedir ve MIRA Token Nasıl Çalışır
Proje Omega Elon Musk: Gerçek mi, Efsane mi?

2025 BAND Fiyat Tahmini: Band Protocol için Piyasa Analizi ve Potansiyel Büyüme Etkenleri
2025 COAI Fiyat Tahmini: Piyasa Trendleri ve Potansiyel Büyüme Faktörlerinin Analizi

Metaverse Dijital Para Birimlerini Güvenli Bir Şekilde Satın Alma Rehberi
ENS Alan Adınızı Kaydettirmenin Sağladığı Avantajlar
Yönetim Tokenlarını Anlamak: Web3 Dünyasında Merkeziyetsiz Finansın Derinliklerine Yolculuk