ALCX ve OP: Kripto dünyasını yeniden şekillendiren iki DeFi protokolünün kapsamlı analizi

Giriş: ALCX ve OP Yatırım Karşılaştırması
Kripto para piyasasında Alchemix (ALCX) ve Optimism (OP) karşılaştırması, yatırımcılar için kaçınılmaz bir gündem haline gelmiştir. Her iki varlık, piyasa değeri sıralaması, kullanım alanları ve fiyat performansı açısından belirgin farklar göstermenin yanı sıra, kripto varlık ekosisteminde farklı konumları temsil etmektedir.
Alchemix (ALCX): 2021’de piyasaya sürülen bu varlık, kullanıcıların mevduatlarından gelecekteki kazançlarını sentetik varlık tokenleriyle elde etmesini sağlayan yenilikçi DeFi protokolü sayesinde piyasada kabul görmüştür.
Optimism (OP): 2022’de tanıtılan OP, düşük maliyetli ve oldukça hızlı bir Ethereum Layer 2 blokzincir çözümü olarak öne çıkmakta ve geliştiriciler ile kullanıcıların pratik ihtiyaçlarını karşılamaktadır.
Bu makalede, ALCX ve OP’nin yatırım değerleri kapsamlı biçimde analiz edilecek; fiyat geçmişi, arz mekanizması, kurumsal benimseme, teknolojik ekosistem ve geleceğe dair öngörüler başlıklarında incelemeler sunulacak ve yatırımcıların en çok merak ettiği şu soruya yanıt aranacaktır:
"Hangisi şu anda daha iyi bir yatırım fırsatı?"
I. Fiyat Geçmişi Karşılaştırması ve Güncel Piyasa Görünümü
ALCX ve OP Tarihi Fiyat Eğilimleri
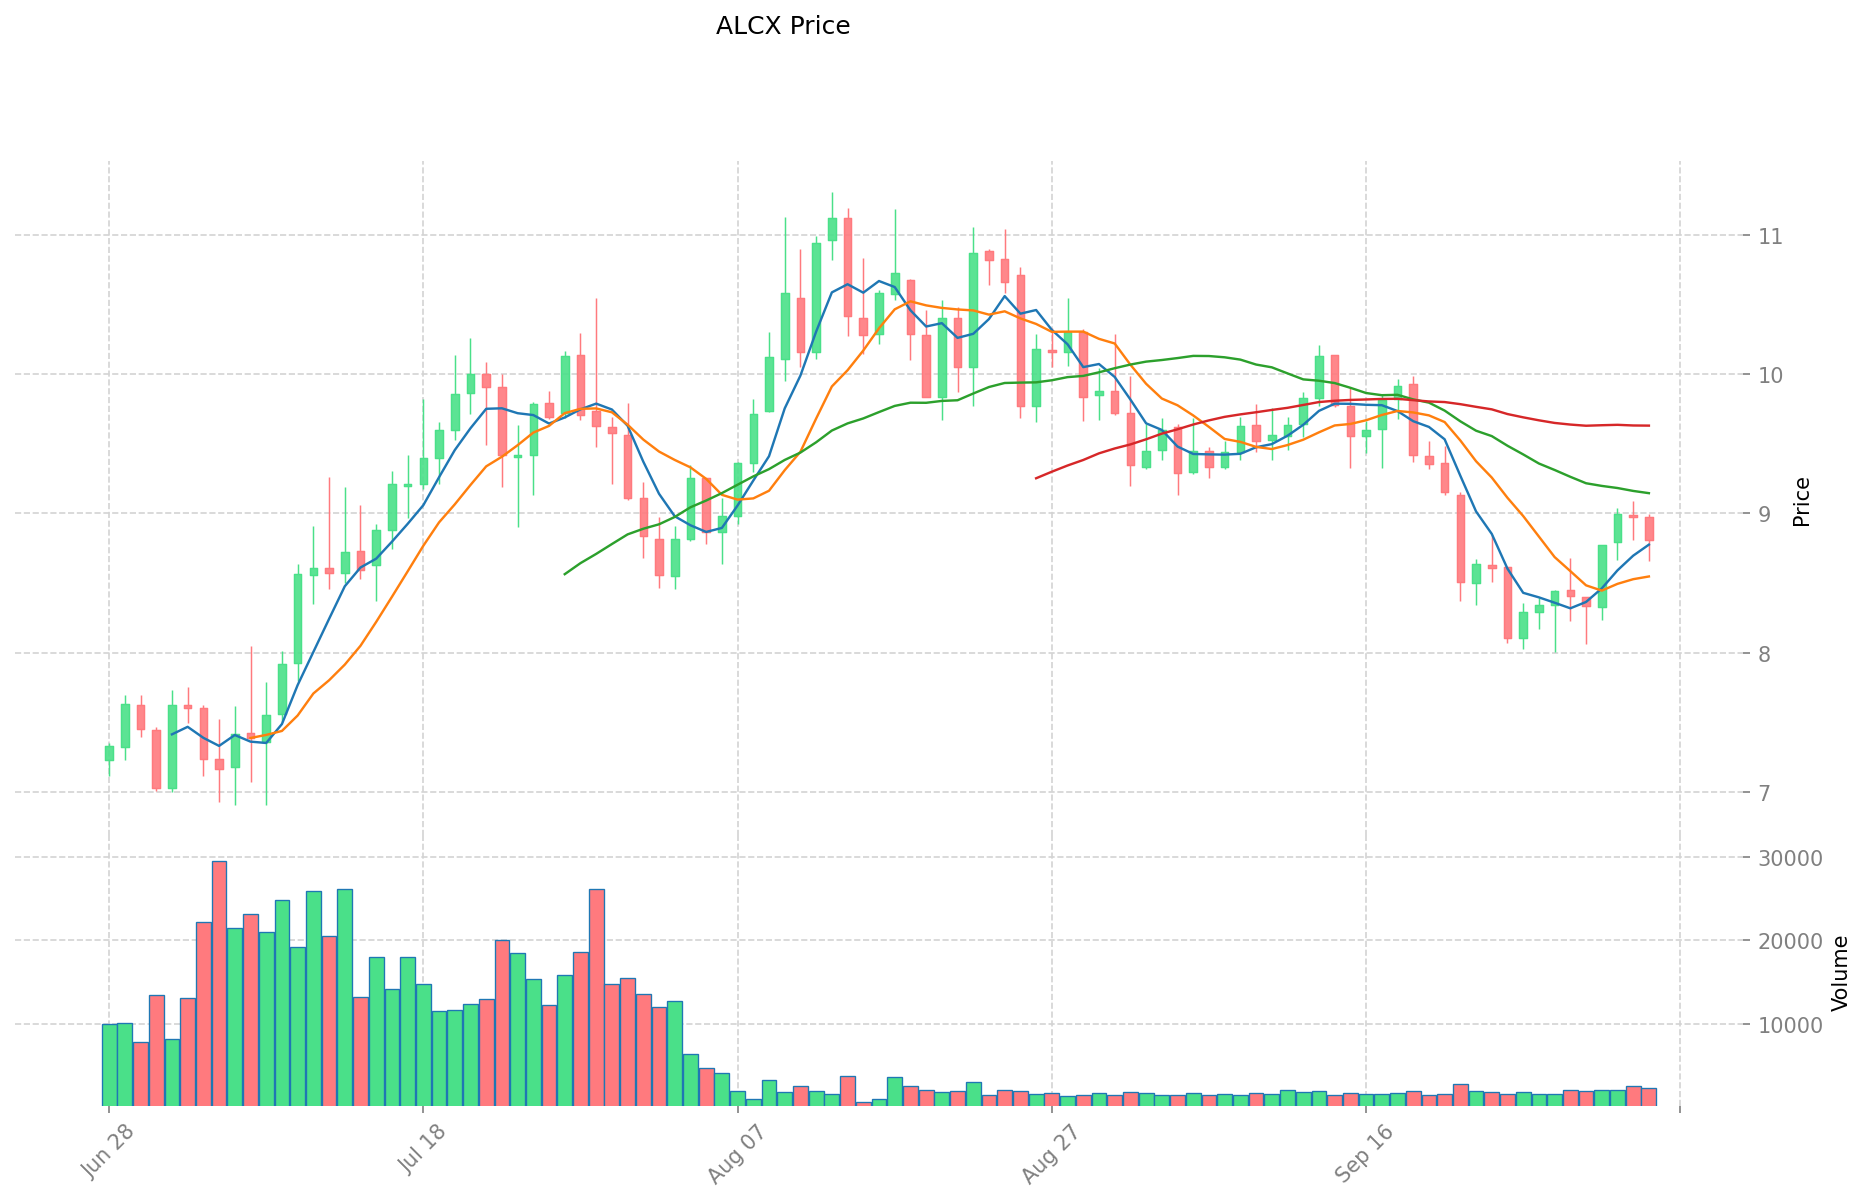
- 2021: ALCX, 21 Mart 2021’de 2.066,2 $ ile tüm zamanların en yüksek değerine ulaştı.
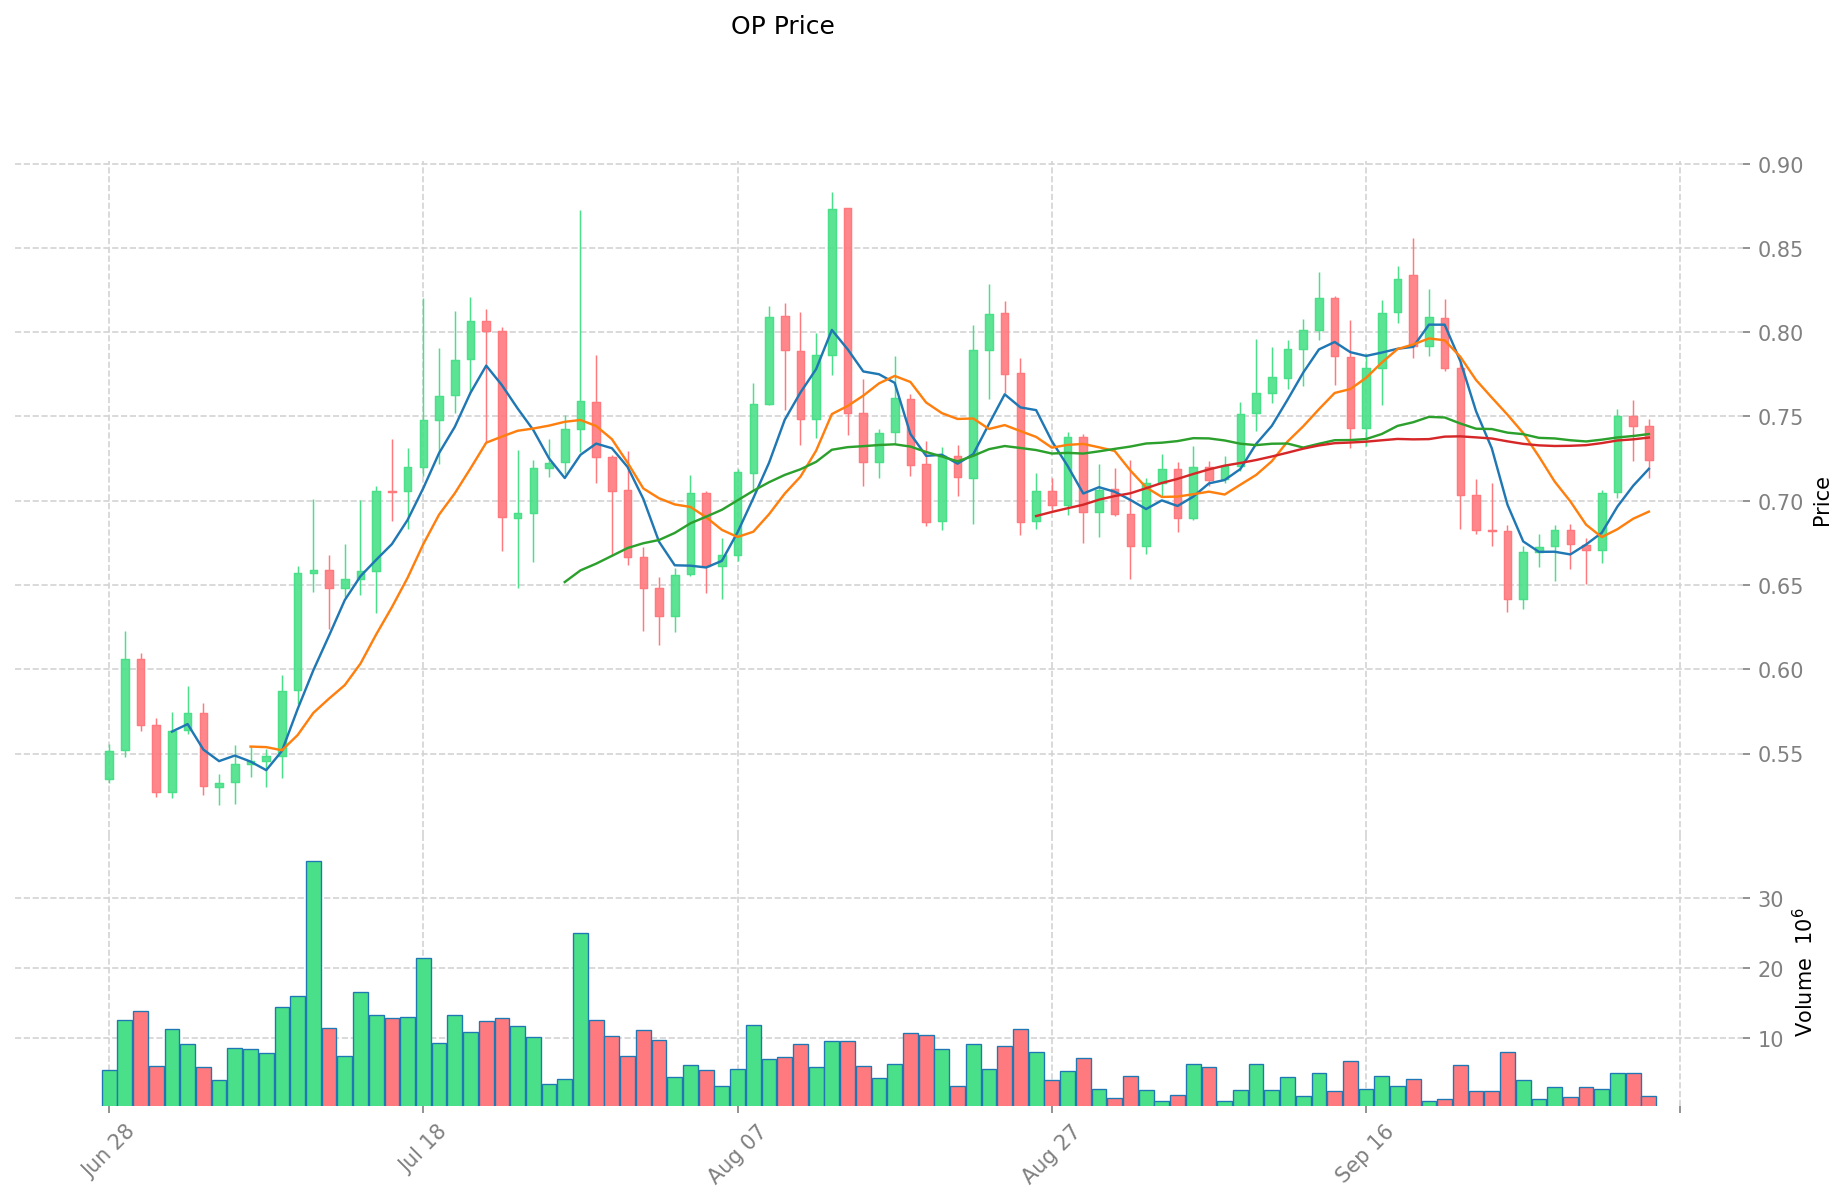
- 2024: OP, 6 Mart 2024’te 4,84 $ ile zirveye çıktı.
- Karşılaştırmalı Analiz: Son piyasa döngüsünde, ALCX 2.066,2 $’dan 6,57 $’a kadar gerilerken OP daha dirençli bir performans göstererek en düşük seviyesi olan 0,402159 $’ın üzerinde fiyatını korudu.
Güncel Piyasa Durumu (05 Ekim 2025)
- ALCX güncel fiyatı: 8,8 $
- OP güncel fiyatı: 0,7241 $
- 24 saatlik işlem hacmi: ALCX 21.136,85 $ - OP 1.326.306,88 $
- Piyasa Duyarlılık Endeksi (Korku & Açgözlülük): 71 (Açgözlülük)
Gerçek zamanlı fiyatlar için tıklayın:
- ALCX güncel fiyatı Piyasa Fiyatı
- OP güncel fiyatı Piyasa Fiyatı
II. ALCX ve OP Yatırım Değerini Etkileyen Temel Faktörler
Arz Mekanizması Karşılaştırması (Tokenomics)
- OP: Token, yapılandırılmış bir dağıtım takvimine sahiptir; operasyonel karlar ise içsel değerini etkiler. Cancun yükseltmesi, maliyet avantajı ve zincir içi aktivite artışı ile tokenın değerini yükseltme potansiyeli sunar.
- ALCX: Sunulan materyallerde sınırlı bilgi mevcut.
- 📌 Tarihsel Eğilim: Layer 2 operasyon karlarının yüksek olduğu dönemlerde tokenın içsel değeri artar ve piyasa değerlemesi olumlu etkilenir.
Kurumsal Benimseme ve Piyasa Uygulamaları
- Kurumsal Varlıklar: Sunulan materyallerde sınırlı bilgi mevcut.
- Kurumsal Benimseme: Sunulan materyallerde sınırlı bilgi mevcut.
- Regülasyon Yaklaşımları: Sunulan materyallerde sınırlı bilgi mevcut.
Teknik Gelişim ve Ekosistem Oluşumu
- OP Teknik Güncellemeleri: Cancun yükseltmesi, Layer 2 projelerinin (OP dahil) maliyet avantajı ve zincir içi aktiviteyi artırma potansiyeli taşır.
- ALCX Teknik Gelişimi: Sunulan materyallerde sınırlı bilgi mevcut.
- Ekosistem Karşılaştırması: Sunulan materyallerde sınırlı bilgi mevcut.
Makroekonomik Faktörler ve Piyasa Döngüleri
- Enflasyon Performansı: Sunulan materyallerde sınırlı bilgi mevcut.
- Para Politikası Etkisi: Sunulan materyallerde sınırlı bilgi mevcut.
- Jeopolitik Faktörler: Sunulan materyallerde sınırlı bilgi mevcut. III. 2025-2030 Fiyat Tahmini: ALCX vs OP
Kısa Vadeli Tahmin (2025)
- ALCX: Temkinli 5,11 - 8,81 $ | İyimser 8,81 - 10,66 $
- OP: Temkinli 0,41 - 0,72 $ | İyimser 0,72 - 1,00 $
Orta Vadeli Tahmin (2027)
- ALCX büyüme aşamasına geçebilir ve tahmini fiyat aralığı 9,22 - 13,95 $ olabilir.
- OP büyüme aşamasına geçebilir ve tahmini fiyat aralığı 0,74 - 1,29 $ olabilir.
- Başlıca itici güçler: Kurumsal sermaye girişi, ETF ve ekosistem gelişimi.
Uzun Vadeli Tahmin (2030)
- ALCX: Temel senaryo 8,28 - 15,93 $ | İyimser senaryo 15,93 - 19,12 $
- OP: Temel senaryo 0,97 - 1,62 $ | İyimser senaryo 1,62 - 1,99 $
Feragatname
ALCX:
| Yıl | Tahmini En Yüksek Fiyat | Tahmini Ortalama Fiyat | Tahmini En Düşük Fiyat | Değişim Oranı |
|---|---|---|---|---|
| 2025 | 10,65526 | 8,806 | 5,10748 | 0 |
| 2026 | 13,9148009 | 9,73063 | 5,4491528 | 10 |
| 2027 | 13,950804231 | 11,82271545 | 9,221718051 | 34 |
| 2028 | 16,75278779265 | 12,8867598405 | 7,860923502705 | 46 |
| 2029 | 17,04273988906125 | 14,819773816575 | 13,48599417308325 | 68 |
| 2030 | 19,11750822338175 | 15,931256852818125 | 8,284253563465425 | 81 |
OP:
| Yıl | Tahmini En Yüksek Fiyat | Tahmini Ortalama Fiyat | Tahmini En Düşük Fiyat | Değişim Oranı |
|---|---|---|---|---|
| 2025 | 0,999948 | 0,7246 | 0,405776 | 0 |
| 2026 | 0,93987866 | 0,862274 | 0,45700522 | 19 |
| 2027 | 1,2885391519 | 0,90107633 | 0,7388825906 | 24 |
| 2028 | 1,554626992149 | 1,09480774095 | 0,6897288767985 | 51 |
| 2029 | 1,90759300783128 | 1,3247173665495 | 1,24523432455653 | 82 |
| 2030 | 1,987870880244179 | 1,61615518719039 | 0,969693112314234 | 123 |
IV. Yatırım Stratejisi Karşılaştırması: ALCX ve OP
Uzun Vadeli ve Kısa Vadeli Yatırım Stratejisi
- ALCX: DeFi inovasyonu ve gelecekteki getiri potansiyeliyle ilgilenen yatırımcılara uygundur
- OP: Ethereum ölçeklenme çözümleri ve Layer 2 ekosisteminin büyümesine odaklanan yatırımcılar için uygundur
Risk Yönetimi ve Varlık Dağılımı
- Temkinli yatırımcılar için: ALCX %30 - OP %70
- Aggresif yatırımcılar için: ALCX %60 - OP %40
- Koruma araçları: Stablecoin tahsisi, opsiyonlar ve çapraz-token portföyü
V. Potansiyel Risk Karşılaştırması
Piyasa Riski
- ALCX: Küçük piyasa değeri ve niş DeFi odağı nedeniyle yüksek volatilite
- OP: Ethereum’un başarısı ve Layer 2 çözümlerinin benimsenmesine bağlıdır
Teknik Risk
- ALCX: Akıllı sözleşme zaafları ve ölçeklenebilirlik sorunları
- OP: Ağ istikrarı ve Layer 2 uygulamasında olası yazılım hataları
Regülasyon Riski
- Küresel regülasyonlar iki tokenı farklı etkileyebilir; DeFi protokolleri daha fazla denetimle karşılaşabilir
VI. Sonuç: Hangisi Daha İyi Bir Alım?
📌 Yatırım Değeri Özeti:
- ALCX avantajları: Yenilikçi DeFi protokolü, boğa piyasasında yüksek getiri potansiyeli
- OP avantajları: Güçlü ekosistem büyümesi, Ethereum’un popülaritesinden aldığı destek, uzun vadeli benimseme potansiyeli
✅ Yatırım Tavsiyesi:
- Yeni yatırımcılar: OP’yi çeşitlendirilmiş portföyde daha düşük oranla değerlendirebilir
- Deneyimli yatırımcılar: Hem ALCX hem OP ile dengeli bir portföy oluşturulabilir, risk toleransına göre ayarlama yapılabilir
- Kurumsal yatırımcılar: OP’nin yüksek piyasa değeri ve ekosistem potansiyeline ağırlık verilmeli, DeFi inovasyonuna maruz kalmak için ALCX’e sınırlı bir pay ayrılabilir
⚠️ Risk Uyarısı: Kripto para piyasası yüksek volatiliteye sahiptir. Bu makale yatırım tavsiyesi değildir. None
VII. Sıkça Sorulan Sorular
S1: ALCX ve OP’nin temel farklılıkları nelerdir? C: ALCX, mevduatlardan gelecekteki kazançları sunan bir DeFi protokol tokenıdır; OP ise Ethereum için Layer 2 ölçekleme çözümüdür. ALCX’in piyasa değeri daha küçük olup inovatif DeFi uygulamalarına odaklanırken, OP daha büyük bir ekosisteme sahip ve Ethereum’un ölçeklenebilirliğini geliştirmeye yöneliktir.
S2: Geçmişte hangi token daha iyi performans gösterdi? C: OP son piyasa döngülerinde daha dirençli oldu. ALCX, 2021’de 2.066,2 $ ile zirveye ulaşıp ciddi oranda gerilerken; OP, 2024’te 4,84 $ ile zirveye çıkıp en düşük seviyesinin üzerinde kaldı.
S3: Gelecekteki fiyat tahminleri ALCX ve OP için nasıl karşılaştırılıyor? C: 2030’da ALCX’in 8,28 - 19,12 $ aralığına, OP’nin ise 0,97 - 1,99 $ aralığına ulaşması bekleniyor. Her iki tokenın büyüme potansiyeli bulunuyor, OP ise daha istikrarlı getiri sunabilir.
S4: ALCX ve OP yatırımıyla ilgili başlıca riskler nelerdir? C: ALCX, küçük piyasa değeri ve niş DeFi odağı nedeniyle yüksek volatilite ve akıllı sözleşme zaaflarıyla karşı karşıya. OP’nin ana riskleri ise Ethereum’un başarısına bağımlılık ve Layer 2 uygulamasında teknik sorunlar yaşama ihtimalidir.
S5: Kurumsal benimseme bu tokenları nasıl etkileyebilir? C: Mevcut kurumsal varlıklar hakkında net bilgi olmasa da, OP daha büyük piyasa değeri ve Ethereum ölçeklenme çözümleriyle kurumsal yatırımcılar için daha cazip olabilir. ALCX ise yenilikçi DeFi ürünlerine ilgi duyan kurumların tercih edebileceği bir alternatiftir.
S6: Önümüzdeki yıllarda ALCX ve OP’nin büyümesini hangi faktörler tetikleyebilir? C: Her iki token için kurumsal sermaye girişi, olası ETF onayları ve ekosistem gelişimi büyümenin ana itici güçleri arasında. OP özelinde, Ethereum’un başarısı ve Layer 2 çözümlerinin yaygınlaşması önemli bir büyüme faktörü olabilir.
S7: Yatırımcılar ALCX ve OP arasında nasıl tahsis yapmalı? C: Temkinli yatırımcılar ALCX’e %30, OP’ye %70 ayırabilir; agresif yatırımcılar ise ALCX’i %60, OP’yi %40 oranında değerlendirebilir. Yeni yatırımcılar, OP’yi çeşitlendirilmiş portföyde daha düşük bir oranda tutarak başlayabilir.
Share
Content
Giriş: ALCX ve OP Yatırım Karşılaştırması
I. Fiyat Geçmişi Karşılaştırması ve Güncel Piyasa Görünümü
II. ALCX ve OP Yatırım Değerini Etkileyen Temel Faktörler
IV. Yatırım Stratejisi Karşılaştırması: ALCX ve OP
V. Potansiyel Risk Karşılaştırması
VI. Sonuç: Hangisi Daha İyi Bir Alım?
VII. Sıkça Sorulan Sorular
How to Buy Cryptocurrency


Trending Cryptocurrencies


GLQ ve ARB: Kuantum Hesaplama Algoritmaları ile Klasik Bit Tabanlı Yaklaşımların Karşılaştırmalı Analizi

EtherVista (VISTA) iyi bir yatırım mı?: Bu yükselen kripto paranın potansiyelini ve risklerini değerlendirmek

Optimism (OP) iyi bir yatırım mı?: Ethereum Layer 2 ölçeklendirme çözümünün potansiyeli ve riskleri üzerine analiz

ARB vs NEAR: İki Yükselen Blockchain Ekosisteminin Karşılaştırmalı Analizi

VISTA ve ARB: Diyabetik Hastalarda Hipertansiyon Yönetiminde İki Yaklaşımın Karşılaştırılması
Eclipse (ES) yatırım için uygun mu?: Bu Yeni Dijital Varlığın Risk ve Getiri Profili üzerine Analiz
Linea Ekosisteminde Layer 2 ölçeklendirmesinin potansiyelini açığa çıkarmak
SOL nedir: Solana Blockchain Ağı ve Yerel Kripto Para Birimi Üzerine Detaylı Bir Rehber

GameFi Dünyasını Keşfetmek: Kavramı ve İşleyişi Üzerine Derinlemesine Bir Bakış
XRP nedir: Ripple’ın Yerel Kripto Parası ve Küresel Ödemelerdeki Rolüne Kapsamlı Rehber
USDC Nedir: USD Coin’e Dair Kapsamlı Rehber ve Kripto Para Piyasalarındaki Yeri