ES vs QNT: Comparing Enterprise Solutions and Quantitative Technologies in Modern Business Applications
Introduction: Investment Comparison between ES and QNT
In the cryptocurrency market, the comparison between Eclipse (ES) and Quant (QNT) has been an unavoidable topic for investors. The two not only show significant differences in market cap ranking, application scenarios, and price performance but also represent different positioning in the crypto asset landscape.
Eclipse (ES): Launched as Ethereum's first Solana Virtual Machine (SVM) L2 solution, it has gained market recognition for its innovative modular architecture combining Ethereum settlement, SVM execution, and Celestia for data availability.
Quant (QNT): Introduced in 2018, it has been acclaimed as a technology provider enabling trusted digital interaction, recognized for solving interoperability through the creation of a global blockchain operating system, Overledger.
This article will comprehensively analyze the investment value comparison between ES and QNT, focusing on historical price trends, supply mechanisms, institutional adoption, technological ecosystems, and future predictions, attempting to answer the question investors are most concerned about:
"Which is the better buy right now?"
I. Price History Comparison and Current Market Status
Eclipse (ES) and Quant (QNT) Historical Price Trends
- 2025: ES launched as Ethereum's first Solana Virtual Machine (SVM) L2 solution, attracting significant attention.
- 2021: QNT reached its all-time high of $427.42 on September 11, 2021, due to increasing adoption of its interoperability solutions.
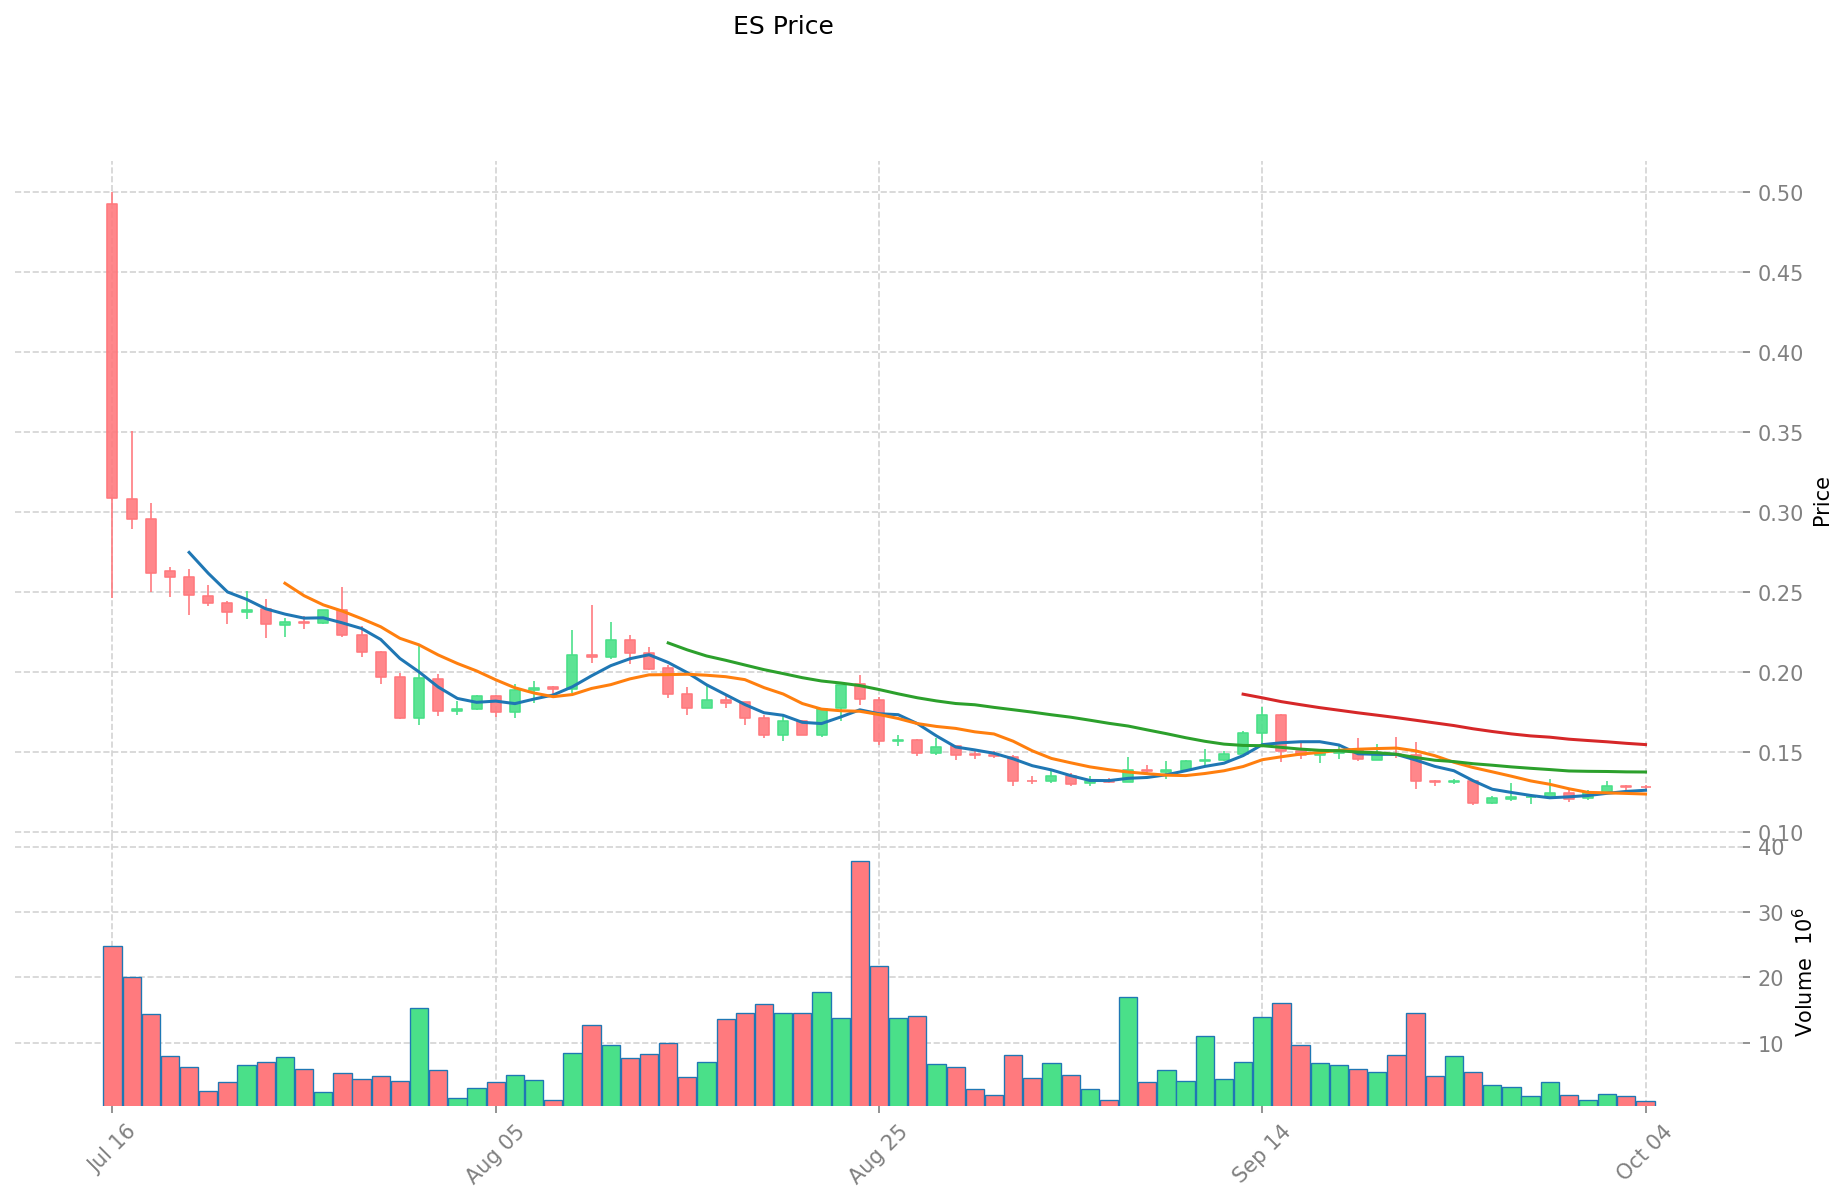
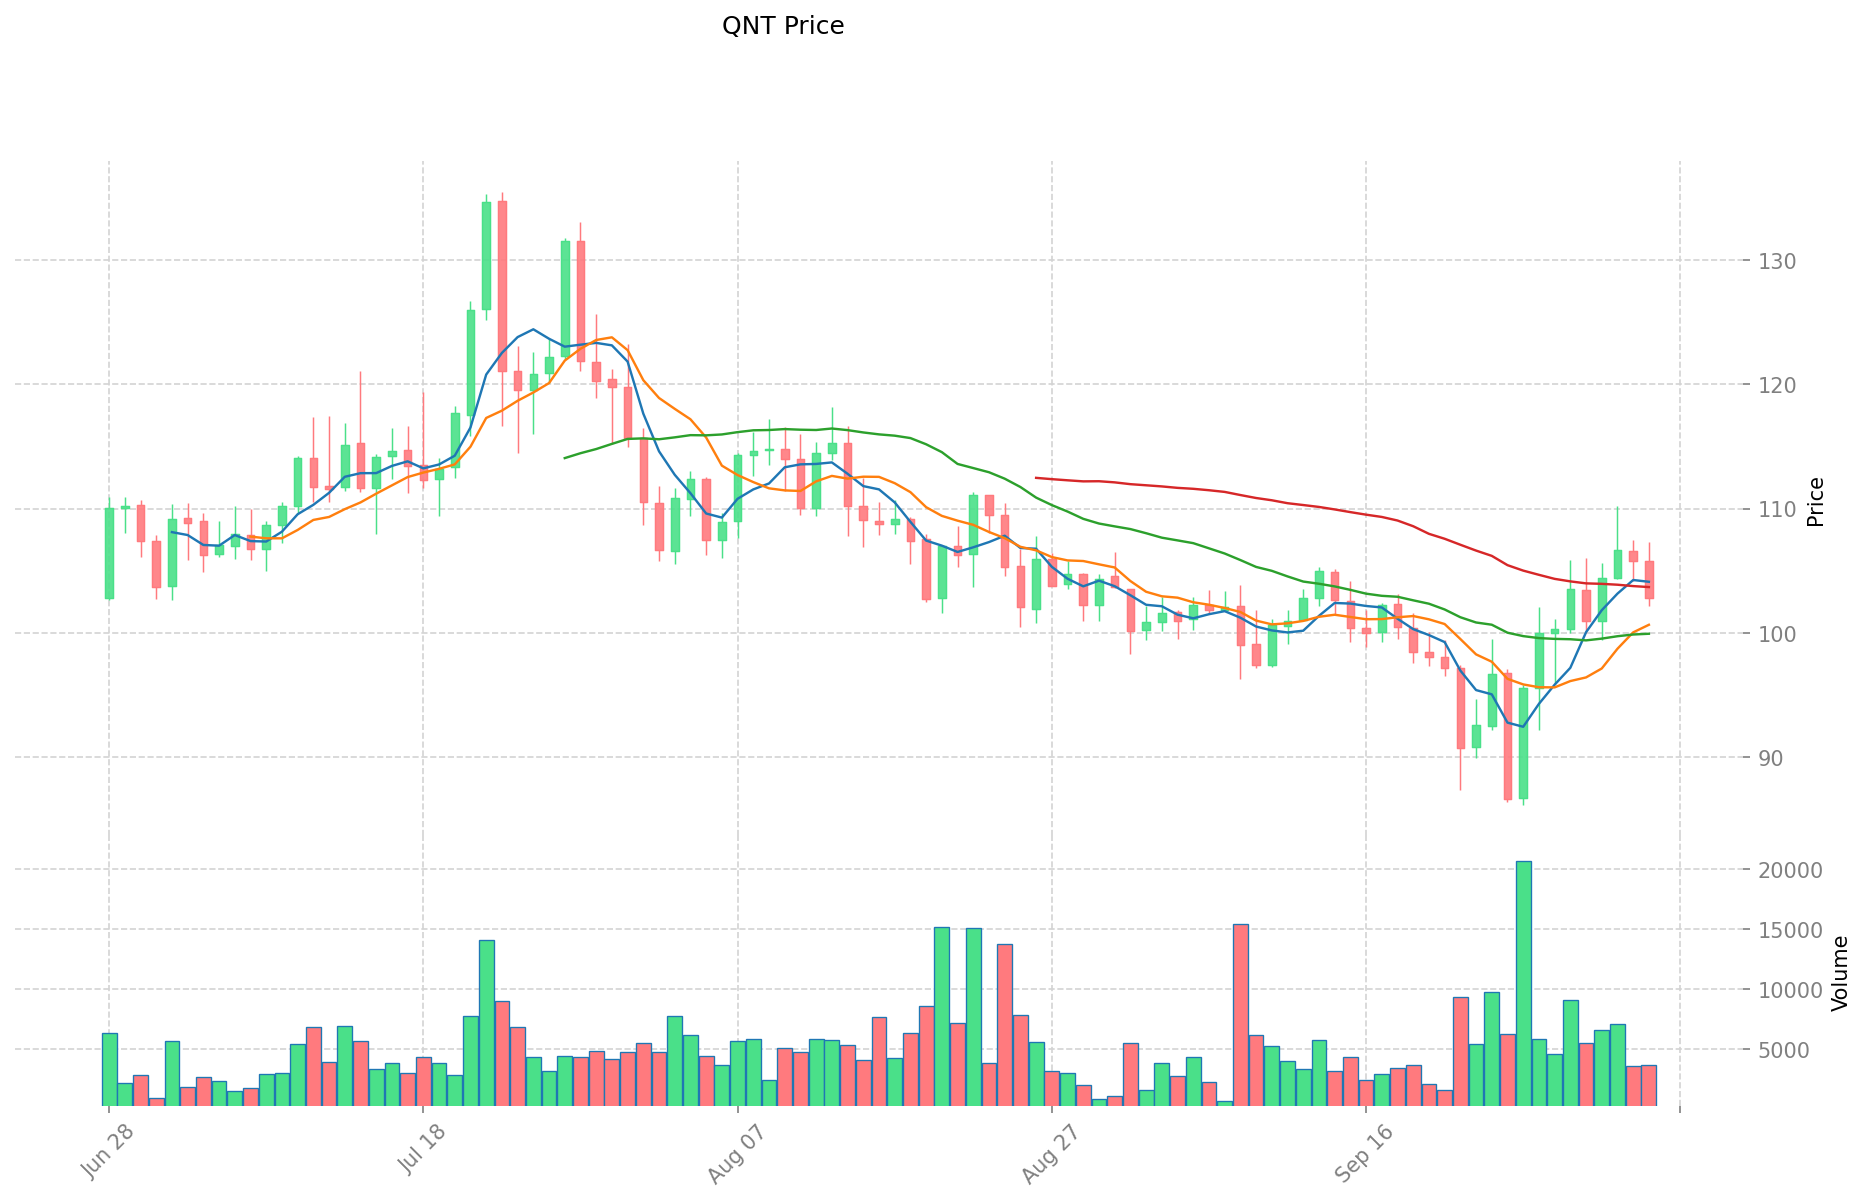
- Comparative analysis: In the recent market cycle, ES has fluctuated between its all-time high of $0.5 and low of $0.1167, while QNT has shown more stability, maintaining a price above $100 despite market volatility.
Current Market Situation (2025-10-05)
- ES current price: $0.1272
- QNT current price: $103.22
- 24-hour trading volume: ES $144,363.81 vs QNT $382,166.44
- Market Sentiment Index (Fear & Greed Index): 74 (Greed)
Click to view real-time prices:
- View ES current price Market Price
- View QNT current price Market Price
II. Core Factors Affecting the Investment Value of ES vs QNT
Supply Mechanism Comparison (Tokenomics)
- QNT: The native token QNT is used to pay license fees and access services in the Overledger network. It has inherent demand as enterprises use it to develop multi-chain applications (mDApps).
Institutional Adoption and Market Applications
- Enterprise Adoption: QNT is designed for blockchain interoperability, creating a blockchain ecosystem where different networks can communicate with each other.
- Regulatory Attitudes: As a blockchain interoperability project, QNT aims to bridge gaps between different blockchains, which could position it favorably in regulatory frameworks focused on interoperability.
Technical Development and Ecosystem Building
- QNT Technical Development: Quant is a blockchain interoperability project aimed at bridging the gaps between different blockchains. It offers a unique solution designed to create a blockchain ecosystem where networks can communicate with each other.
- Ecosystem Comparison: QNT facilitates multi-chain applications, allowing businesses across various industries to develop solutions that work across blockchain networks.
Macroeconomic Factors and Market Cycles
- Inflationary Environment Performance: As global industries from finance to other sectors increasingly adopt blockchain solutions, the demand for interoperability solutions like QNT may increase.
III. 2025-2030 Price Prediction: ES vs QNT
Short-term Prediction (2025)
- ES: Conservative $0.066508 - $0.1279 | Optimistic $0.1279 - $0.177781
- QNT: Conservative $99.1584 - $103.29 | Optimistic $103.29 - $106.3887
Mid-term Prediction (2027)
- ES may enter a growth phase, with prices estimated between $0.12384665715 - $0.212547641325
- QNT may enter a growth phase, with prices estimated between $74.18432406 - $163.71712896
- Key drivers: Institutional capital inflow, ETFs, ecosystem development
Long-term Prediction (2030)
- ES: Base scenario $0.153916160035053 - $0.229725611992617 | Optimistic scenario $0.229725611992617 - $0.330804881269368
- QNT: Base scenario $124.36606193661342 - $161.514366151446 | Optimistic scenario $161.514366151446 - $206.73838867385088
Disclaimer: The above predictions are based on historical data and market analysis. Cryptocurrency markets are highly volatile and subject to change. This information should not be considered as financial advice.
ES:
| 年份 | 预测最高价 | 预测平均价格 | 预测最低价 | 涨跌幅 |
|---|---|---|---|---|
| 2025 | 0.177781 | 0.1279 | 0.066508 | 0 |
| 2026 | 0.181880195 | 0.1528405 | 0.08864749 | 20 |
| 2027 | 0.212547641325 | 0.1673603475 | 0.12384665715 | 31 |
| 2028 | 0.237442493015625 | 0.1899539944125 | 0.13296779608875 | 49 |
| 2029 | 0.245752980271171 | 0.213698243714062 | 0.190191436905515 | 68 |
| 2030 | 0.330804881269368 | 0.229725611992617 | 0.153916160035053 | 80 |
QNT:
| 年份 | 预测最高价 | 预测平均价格 | 预测最低价 | 涨跌幅 |
|---|---|---|---|---|
| 2025 | 106.3887 | 103.29 | 99.1584 | 0 |
| 2026 | 150.968664 | 104.83935 | 87.0166605 | 1 |
| 2027 | 163.71712896 | 127.904007 | 74.18432406 | 23 |
| 2028 | 163.3078361376 | 145.81056798 | 77.2796010294 | 41 |
| 2029 | 168.469530244092 | 154.5592020588 | 102.009073358808 | 49 |
| 2030 | 206.73838867385088 | 161.514366151446 | 124.36606193661342 | 56 |
IV. Investment Strategy Comparison: ES vs QNT
Long-term vs Short-term Investment Strategies
- ES: Suitable for investors focused on Layer 2 solutions and Ethereum ecosystem potential
- QNT: Suitable for investors seeking blockchain interoperability and enterprise adoption
Risk Management and Asset Allocation
- Conservative investors: ES: 20% vs QNT: 80%
- Aggressive investors: ES: 60% vs QNT: 40%
- Hedging tools: Stablecoin allocation, options, cross-currency portfolios
V. Potential Risk Comparison
Market Risks
- ES: Higher volatility due to newer project status
- QNT: Potential market saturation in the interoperability sector
Technical Risks
- ES: Scalability, network stability
- QNT: Adoption rate, potential vulnerabilities in the Overledger system
Regulatory Risks
- Global regulatory policies may have different impacts on both, with QNT potentially facing more scrutiny due to its focus on interoperability
VI. Conclusion: Which Is the Better Buy?
📌 Investment Value Summary:
- ES advantages: Innovative SVM L2 solution, potential for growth in the Ethereum ecosystem
- QNT advantages: Established interoperability solution, enterprise adoption, stable price history
✅ Investment Advice:
- Novice investors: Consider a higher allocation to QNT for its stability and established market presence
- Experienced investors: Balanced approach with both ES and QNT, adjusting based on risk tolerance
- Institutional investors: Focus on QNT for its enterprise-grade solutions and interoperability features
⚠️ Risk Warning: The cryptocurrency market is highly volatile. This article does not constitute investment advice. None
VII. FAQ
Q1: What are the main differences between Eclipse (ES) and Quant (QNT)? A: Eclipse (ES) is Ethereum's first Solana Virtual Machine (SVM) L2 solution, focusing on innovative modular architecture. Quant (QNT) is a blockchain interoperability project aimed at creating a global blockchain operating system called Overledger.
Q2: Which project has shown more price stability? A: Based on historical data, Quant (QNT) has shown more price stability, maintaining a price above $100 despite market volatility. Eclipse (ES), being a newer project, has experienced more significant price fluctuations.
Q3: How do the supply mechanisms of ES and QNT differ? A: While specific details about ES's tokenomics are not provided, QNT's native token is used to pay license fees and access services in the Overledger network, creating inherent demand as enterprises use it to develop multi-chain applications.
Q4: Which project might be more suitable for institutional investors? A: Quant (QNT) might be more suitable for institutional investors due to its focus on enterprise-grade solutions, established interoperability features, and more stable price history.
Q5: What are the key risk factors for each project? A: For ES, key risks include higher volatility due to its newer status, and potential scalability and network stability issues. For QNT, risks include potential market saturation in the interoperability sector and adoption rate challenges.
Q6: How do the long-term price predictions for ES and QNT compare? A: By 2030, ES is predicted to reach between $0.153916160035053 - $0.330804881269368, while QNT is expected to reach between $124.36606193661342 - $206.73838867385088 in the base to optimistic scenarios.
Q7: What factors might influence the future growth of these projects? A: Key factors include institutional capital inflow, potential ETF approvals, ecosystem development, regulatory changes, and the overall adoption of blockchain technology in various industries.
Share
Content