What is the Crypto-Market Technology Analysis
What is a technical analysis of the matter?
Crypto-market technology analysis is the method of taking market behavior (mainly referring to encrypted assets, represented by BTC and ETH) as the research object, finding out its internal rules to judge market trends, and making buying and selling decisions based on the changes in market trends.
The prevailing view on technology analysis mainly refers to modern technical analysis whose system is rather complete and immense ever since the Dow theory. Charles Henry Dow, the founder of the Dow Jones Index in the United States, is honored as the originator of modern technical analysis, and the Dow theory has become the cornerstone and principle of all technical analysis.
All technical analysis theories are based on three assumptions:
- market behavior (price or index) embraces and digests all information;
- the market evolves as a trend with inertia;
- history repeats itself.
Tools for the technical analysis
1.K-line technical analysis
The K-chart, also known as the candle chart, originated in the Tokugawa shogunate era in Japan in the 18th century. It was originally used to record the rice price fluctuations in the market, and has now become the most widely used technical analysis tool in the capital market.
The K line is drawn from the opening price, highest price, lowest price, and closing price of a certain trading cycle (such as a week, day, minute, etc.). An entity is a rectangle drawn between the opening price and the closing price. The highest price and the entity are connected by a straight line, which is called the upper shadow line, and connecting the lowest price and the entity is the lower shadow line.
In the encrypted market, the K line with a closing price higher than the opening price is called the positive line, which is represented by a green entity; otherwise, the negative line is represented by a red entity.
The K-line combination and technical forms based on the K-lines, including the rising K-line combination, falling K-line combination, the bottom-hunting technology form, the top-escape technology form, and the finishing technology form, are the basic components of the crypto-market technical analysis.
2.Technical Analysis of Trends
The trend is a basic way in which all natural and social phenomena, including the physical and spiritual worlds, evolve in a certain period and in a certain amplitude and regularity, including the direction of motion and the energy along the direction of motion. Markets also evolve in a trend way, where trends have inertia.
Trends can be classified into long-term, medium-term, and short-term trends in terms of period. From the direction of the movement, it can be divided into an upward trend, a downward trend, and a sideways finishing trend.
The technical analysis of trends based on the Dow theory has introduced trend lines, support and pressure lines, and channels into technical analysis, all of which play a significant position in the encrypted market.
3.Technical Analysis of Moving Average
The moving average line (or MA), underpinned by the concept of Dow Jones’ average cost and using the “moving average” principle in statistics, presents a curve connected with the price or index average in a certain trading cycle.
The MA, as an indicator that reflects the historical fluctuation and trend of the price or index, can help traders to predict and judge the future trend of the price. It is a digital, graphic, and visualized being of Dow theory and Wave theory.
According to the MA combination, the MA adhesion and divergence, and the forms of the MA, the MA technical analysis has been regarded as the most common and important part of the encrypted market.
In addition to the MA analysis, combining other commonly-used indicators such as MACD, RSI, VOL, BOLL, etc., can help more fully grasp the current long-short games in the market, the strength change of buyers and sellers and the price trend and trend strength.
The purposes of the technical analysis
1.Judging market trends
The premise of all profitable transactions is that the market trend is consistent with the expected opening direction of the position. That is, the price rises after buying in or falls after the short selling. Therefore, it is the most basic and important task to judge the market trend for technical analysis.
According to Dow’s theory, trends have inertia and do not change easily once determined. On top of that, swimming with the market tide and never bucking the trend to open a position is seen as an iron law for professional traders. The key to gaining profits in the encrypted futures market rests with accurately judging whether the current market is in a rising trend, a falling trend, or a sideways trend by virtue of the technical analysis system. So the traders can adopt the corresponding trading strategy to perpetually improve their win rate and profit-loss ratio.
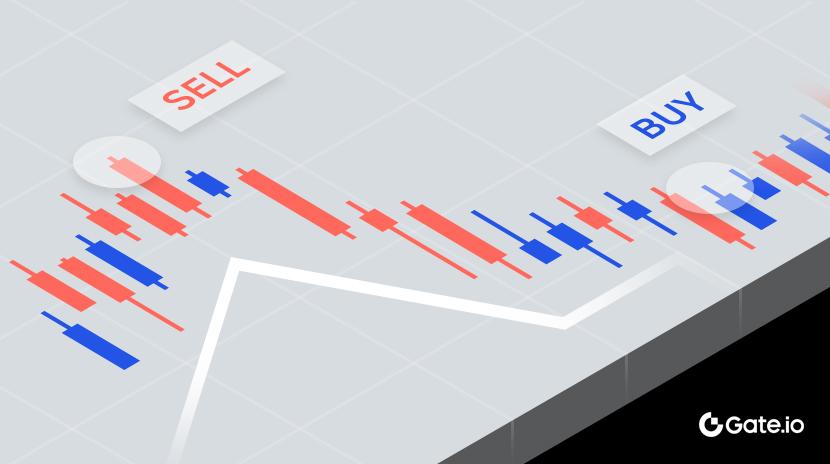
2.Finding buying and selling points
After confirming the trend of the current market in a rising bull market, in a falling bear market, or in a sideways finishing cycle, the next step is to seize the time to enter the market, finding a buying or selling point.
The general strategy is to determine the trend in a major circle and find a chance through minor circles. That is to observe the daily line, and the weekly line of the major cycle by employing MA and K-line systems so as to judge the general trend direction, and then make sure the buying point through finding bottom-hunting forms at the position of 4 hours, 1 hour, or even 15 minutes, like the head and shoulder bottom, double bottom, and round bottom. Similarly, the confirmation of the selling point is basically the same.
3.Confirming the stop-loss or take-profit points
An outstanding trader should cultivate a good habit that every position opening is logical and must take profit or stop loss. Due to the randomness and unpredictability of the market, black swan events may occur at any time. A reasonable trading strategy should include risk management, so the stop-loss and take-profit points will be taken into consideration.
Take-profit can settle part of the profit to avoid profit reduction or even loss as a result of subsequent market changes, while stop-loss can refrain from further expansion in the loss and control the risk within the affordable range.
Brief Summary
In the traditional financial market, technical analysis has formed a complete and systematic method system since its birth. Technical analysis makes three assumptions: the market price digests everything, the trend has inertia, and history will repeat itself. It believes that all capital games, long and short duels, and trading psychology including information collection will leave clues in the market price. The corresponding laws can always be found through scientific analysis. In contrast, investment is simple, and there is nothing new under the sun. The market is always alternating between bull and bear, and during the conversion, greed and fear also affect traders’ decisions.
For futures beginners, it is basic to learn the classic technical analysis system and deeply understand the logic behind it. Only if they find their own strategy, make deals they can handle, and work at their own trading pace, can they survive and develop in the cruel market.
For more firm offer operations of perpetual contracts, please go to the Gate.io Futures platform and click Registration to start your futures journey.

Disclaimer
This article is for information only and such information provided by Gate.io does not constitute any investment advice and is not responsible for any of your investments. Contents about technical analysis, market judgment, trading skills, trader sharing, and so on may involve potential risks, investment variables, and uncertainties. This article does not provide or imply any opportunity to guarantee returns.
Share
Content


Related Articles
Perpetual Contract Funding Rate Arbitrage Strategy in 2025

What is Aevo? All you need to know about AEVO token (2025)
Understanding The Moving Average

Detailed Explanation of Granville 8 Rules (Updated 2025)
Introduction to Funding Rate Arbitrage Quantitative Funds