


#Gate广场四月发帖挑战
BTC Market Update April 5, 2026
65K Support Test: Consolidation Phase,
Not Reversal:
Bitcoin is currently trading at $66,995, holding within a narrow range between $66,610 and $67,547. The 24-hour change is nearly flat at -0.19%. Despite this calm surface, a key technical and macro battle is ongoing. BTC recently dropped to $65,112, its lowest since late February, before recovering. The market is not trending it is deciding direction.
This is a consolidation phase. The key question is whether this is a pause before further downside or a base for a move higher. Current data presents a mixed picture and that itself is the signal.
THE PRICE STRUCTURE WHAT THE LEVELS SAY:
BTC sits between clear technical boundaries.
On the downside, $65,000–$66,610 is the active support zone. The recent low at $66,610 held, and the deeper test at $65,112 also bounced. Below this, next support lies at $63,000–$64,000. A daily close below $65K shifts structure bearish.
On the upside, resistance is between $67,500–$69,000. BTC has failed multiple times near $69K, confirming it as strong resistance. The 4H MA30 ($67,310) and MA120 ($69,075) are both above price.
Daily MAs show a bearish structure: MA7 ($67,332), MA30 ($69,208), MA120 ($78,679) all above price. This confirms a bearish trend structure, meaning rallies face resistance.
THE TECHNICAL SIGNALS DIVERGENCE IS KEY:
Signals are mixed, defining this consolidation phase.
Bearish momentum:
Daily RSI at 44.02 and 4H RSI at 47.38 indicate weak bullish strength. Volume shows a decline with expansion, signaling active sellers.
Bullish divergence:
A MACD bullish divergence is forming. Price made a lower low, but histogram improved from -165.09 to -135.96, showing slowing selling momentum.
SAR confirmation:
Parabolic SAR on both 4H and daily is at $66,610, below price — still bullish. A close below this flips the signal bearish.
Short-term stability:
Price is slightly above the 15-min MA20 ($66,947), showing short-term stability.
👉 Summary: momentum bearish, divergence bullish, structure neutral — a decision zone.
THE MACRO OVERLAY WHY CONSOLIDATION IS HAPPENING:
Macro conditions are heavily influencing BTC.
Oil shock & geopolitics:
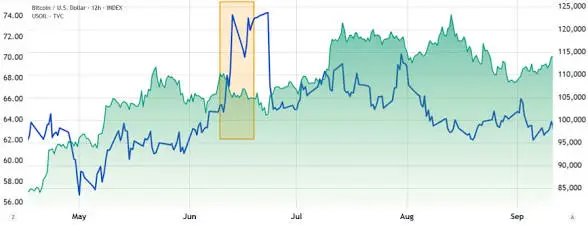
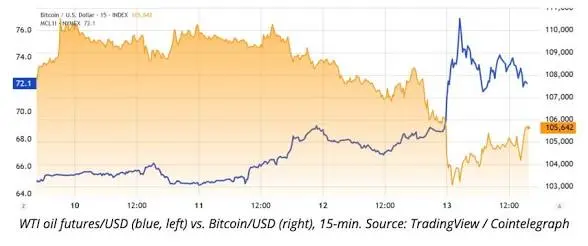
Brent crude reached $141.37, highest since 2008. U.S.–Iran tensions and Strait of Hormuz closure are driving uncertainty. Rising oil pushes inflation higher, limiting rate cuts and pressuring risk assets.
Fear & Greed Index:
At 12 (Extreme Fear) historically a zone where selling slows and accumulation begins.
Federal Reserve outlook:
No rate cuts expected in 2026 due to inflation pressure.
Equity correlation:
S&P 500 down 4.4% YTD. BTC 90-day change at -28.54%, showing macro pressure impact.
ON-CHAIN & INSTITUTIONAL FLOWS
Conflicting signals continue.
• Over $2B BTC moved to exchanges potential selling pressure
• Miners sold significant BTC (including Riot’s 3,778 BTC)
• Total miner selling exceeds 15,000 BTC
On the bullish side:
• Metaplanet acquired 5,075 BTC, total 40,177 BTC
• Target: 100,000 BTC by year-end
Institutional infrastructure is growing, though not impacting price immediately.
KEY LEVELS TO WATCH
Support:
• $66,610 — SAR level
• $65,000 — key floor
• $63K–$64K — next support
Resistance:
• $67,332 — MA7
• $69,000–$69,208 — key ceiling
• $78,679 — macro resistance
👉 Current range: $65K–$69K
THE BOTTOM LINE CONSOLIDATION:
This is not a reversal it is a consolidation phase.
Bearish factors:
• Weak MA structure
• Selling pressure
• Macro risks
Bullish factors:
• MACD divergence
• SAR still bullish
• Extreme Fear = accumulation zone
• Institutional buying present
👉 Final view:
BTC is in a decision zone, not a trend.
The next move will come from a breakout above $69K or breakdown below $65K.
Until then, the market is waiting.
Deadline: April 15th
Details: https://www.gate.com/announcements/article/50520
#AreYouBullishOrBearishToday?
#OilPricesRise
#GateSquareAprilPostingChallenge
BTC Market Update April 5, 2026
65K Support Test: Consolidation Phase,
Not Reversal:
Bitcoin is currently trading at $66,995, holding within a narrow range between $66,610 and $67,547. The 24-hour change is nearly flat at -0.19%. Despite this calm surface, a key technical and macro battle is ongoing. BTC recently dropped to $65,112, its lowest since late February, before recovering. The market is not trending it is deciding direction.
This is a consolidation phase. The key question is whether this is a pause before further downside or a base for a move higher. Current data presents a mixed picture and that itself is the signal.
THE PRICE STRUCTURE WHAT THE LEVELS SAY:
BTC sits between clear technical boundaries.
On the downside, $65,000–$66,610 is the active support zone. The recent low at $66,610 held, and the deeper test at $65,112 also bounced. Below this, next support lies at $63,000–$64,000. A daily close below $65K shifts structure bearish.
On the upside, resistance is between $67,500–$69,000. BTC has failed multiple times near $69K, confirming it as strong resistance. The 4H MA30 ($67,310) and MA120 ($69,075) are both above price.
Daily MAs show a bearish structure: MA7 ($67,332), MA30 ($69,208), MA120 ($78,679) all above price. This confirms a bearish trend structure, meaning rallies face resistance.
THE TECHNICAL SIGNALS DIVERGENCE IS KEY:
Signals are mixed, defining this consolidation phase.
Bearish momentum:
Daily RSI at 44.02 and 4H RSI at 47.38 indicate weak bullish strength. Volume shows a decline with expansion, signaling active sellers.
Bullish divergence:
A MACD bullish divergence is forming. Price made a lower low, but histogram improved from -165.09 to -135.96, showing slowing selling momentum.
SAR confirmation:
Parabolic SAR on both 4H and daily is at $66,610, below price — still bullish. A close below this flips the signal bearish.
Short-term stability:
Price is slightly above the 15-min MA20 ($66,947), showing short-term stability.
👉 Summary: momentum bearish, divergence bullish, structure neutral — a decision zone.
THE MACRO OVERLAY WHY CONSOLIDATION IS HAPPENING:
Macro conditions are heavily influencing BTC.
Oil shock & geopolitics:
Brent crude reached $141.37, highest since 2008. U.S.–Iran tensions and Strait of Hormuz closure are driving uncertainty. Rising oil pushes inflation higher, limiting rate cuts and pressuring risk assets.
Fear & Greed Index:
At 12 (Extreme Fear) historically a zone where selling slows and accumulation begins.
Federal Reserve outlook:
No rate cuts expected in 2026 due to inflation pressure.
Equity correlation:
S&P 500 down 4.4% YTD. BTC 90-day change at -28.54%, showing macro pressure impact.
ON-CHAIN & INSTITUTIONAL FLOWS
Conflicting signals continue.
• Over $2B BTC moved to exchanges potential selling pressure
• Miners sold significant BTC (including Riot’s 3,778 BTC)
• Total miner selling exceeds 15,000 BTC
On the bullish side:
• Metaplanet acquired 5,075 BTC, total 40,177 BTC
• Target: 100,000 BTC by year-end
Institutional infrastructure is growing, though not impacting price immediately.
KEY LEVELS TO WATCH
Support:
• $66,610 — SAR level
• $65,000 — key floor
• $63K–$64K — next support
Resistance:
• $67,332 — MA7
• $69,000–$69,208 — key ceiling
• $78,679 — macro resistance
👉 Current range: $65K–$69K
THE BOTTOM LINE CONSOLIDATION:
This is not a reversal it is a consolidation phase.
Bearish factors:
• Weak MA structure
• Selling pressure
• Macro risks
Bullish factors:
• MACD divergence
• SAR still bullish
• Extreme Fear = accumulation zone
• Institutional buying present
👉 Final view:
BTC is in a decision zone, not a trend.
The next move will come from a breakout above $69K or breakdown below $65K.
Until then, the market is waiting.
Deadline: April 15th
Details: https://www.gate.com/announcements/article/50520
#AreYouBullishOrBearishToday?
#OilPricesRise
#GateSquareAprilPostingChallenge