Application of Relative Strength Indicator - RSI
This "Gate Learn Futures" intermediate course introduces concepts and application of various technical indicators, including candlestick charts, technical patterns, moving averages, and trend lines. This article mainly introduces the concept of relative strength index, RSI, explaining the index composition, technical meaning and practical application of the indicator.
What is Relative Strength Index, RSI?
What is the Relative Strength Index? By definition, the RSI is a momentum-based oscillator that measures the speed and magnitude of price movements. Oscillating between a horizontal axis of 0 and 100, it reflects the balance of buying and selling forces by comparing closing prices in current and previous K-line charts.
Traders can set the RSI thresholds to 20 and 80, or 10 and 90, according to their individual trading styles. The shorter the timeframe of the indicator, the more responsive it becomes. In comparison, the foreign exchange market experiences the smallest fluctuations in the Index, while the largest fluctuations occur in the cryptocurrency market and intermediate fluctuations are seen in the stock market.
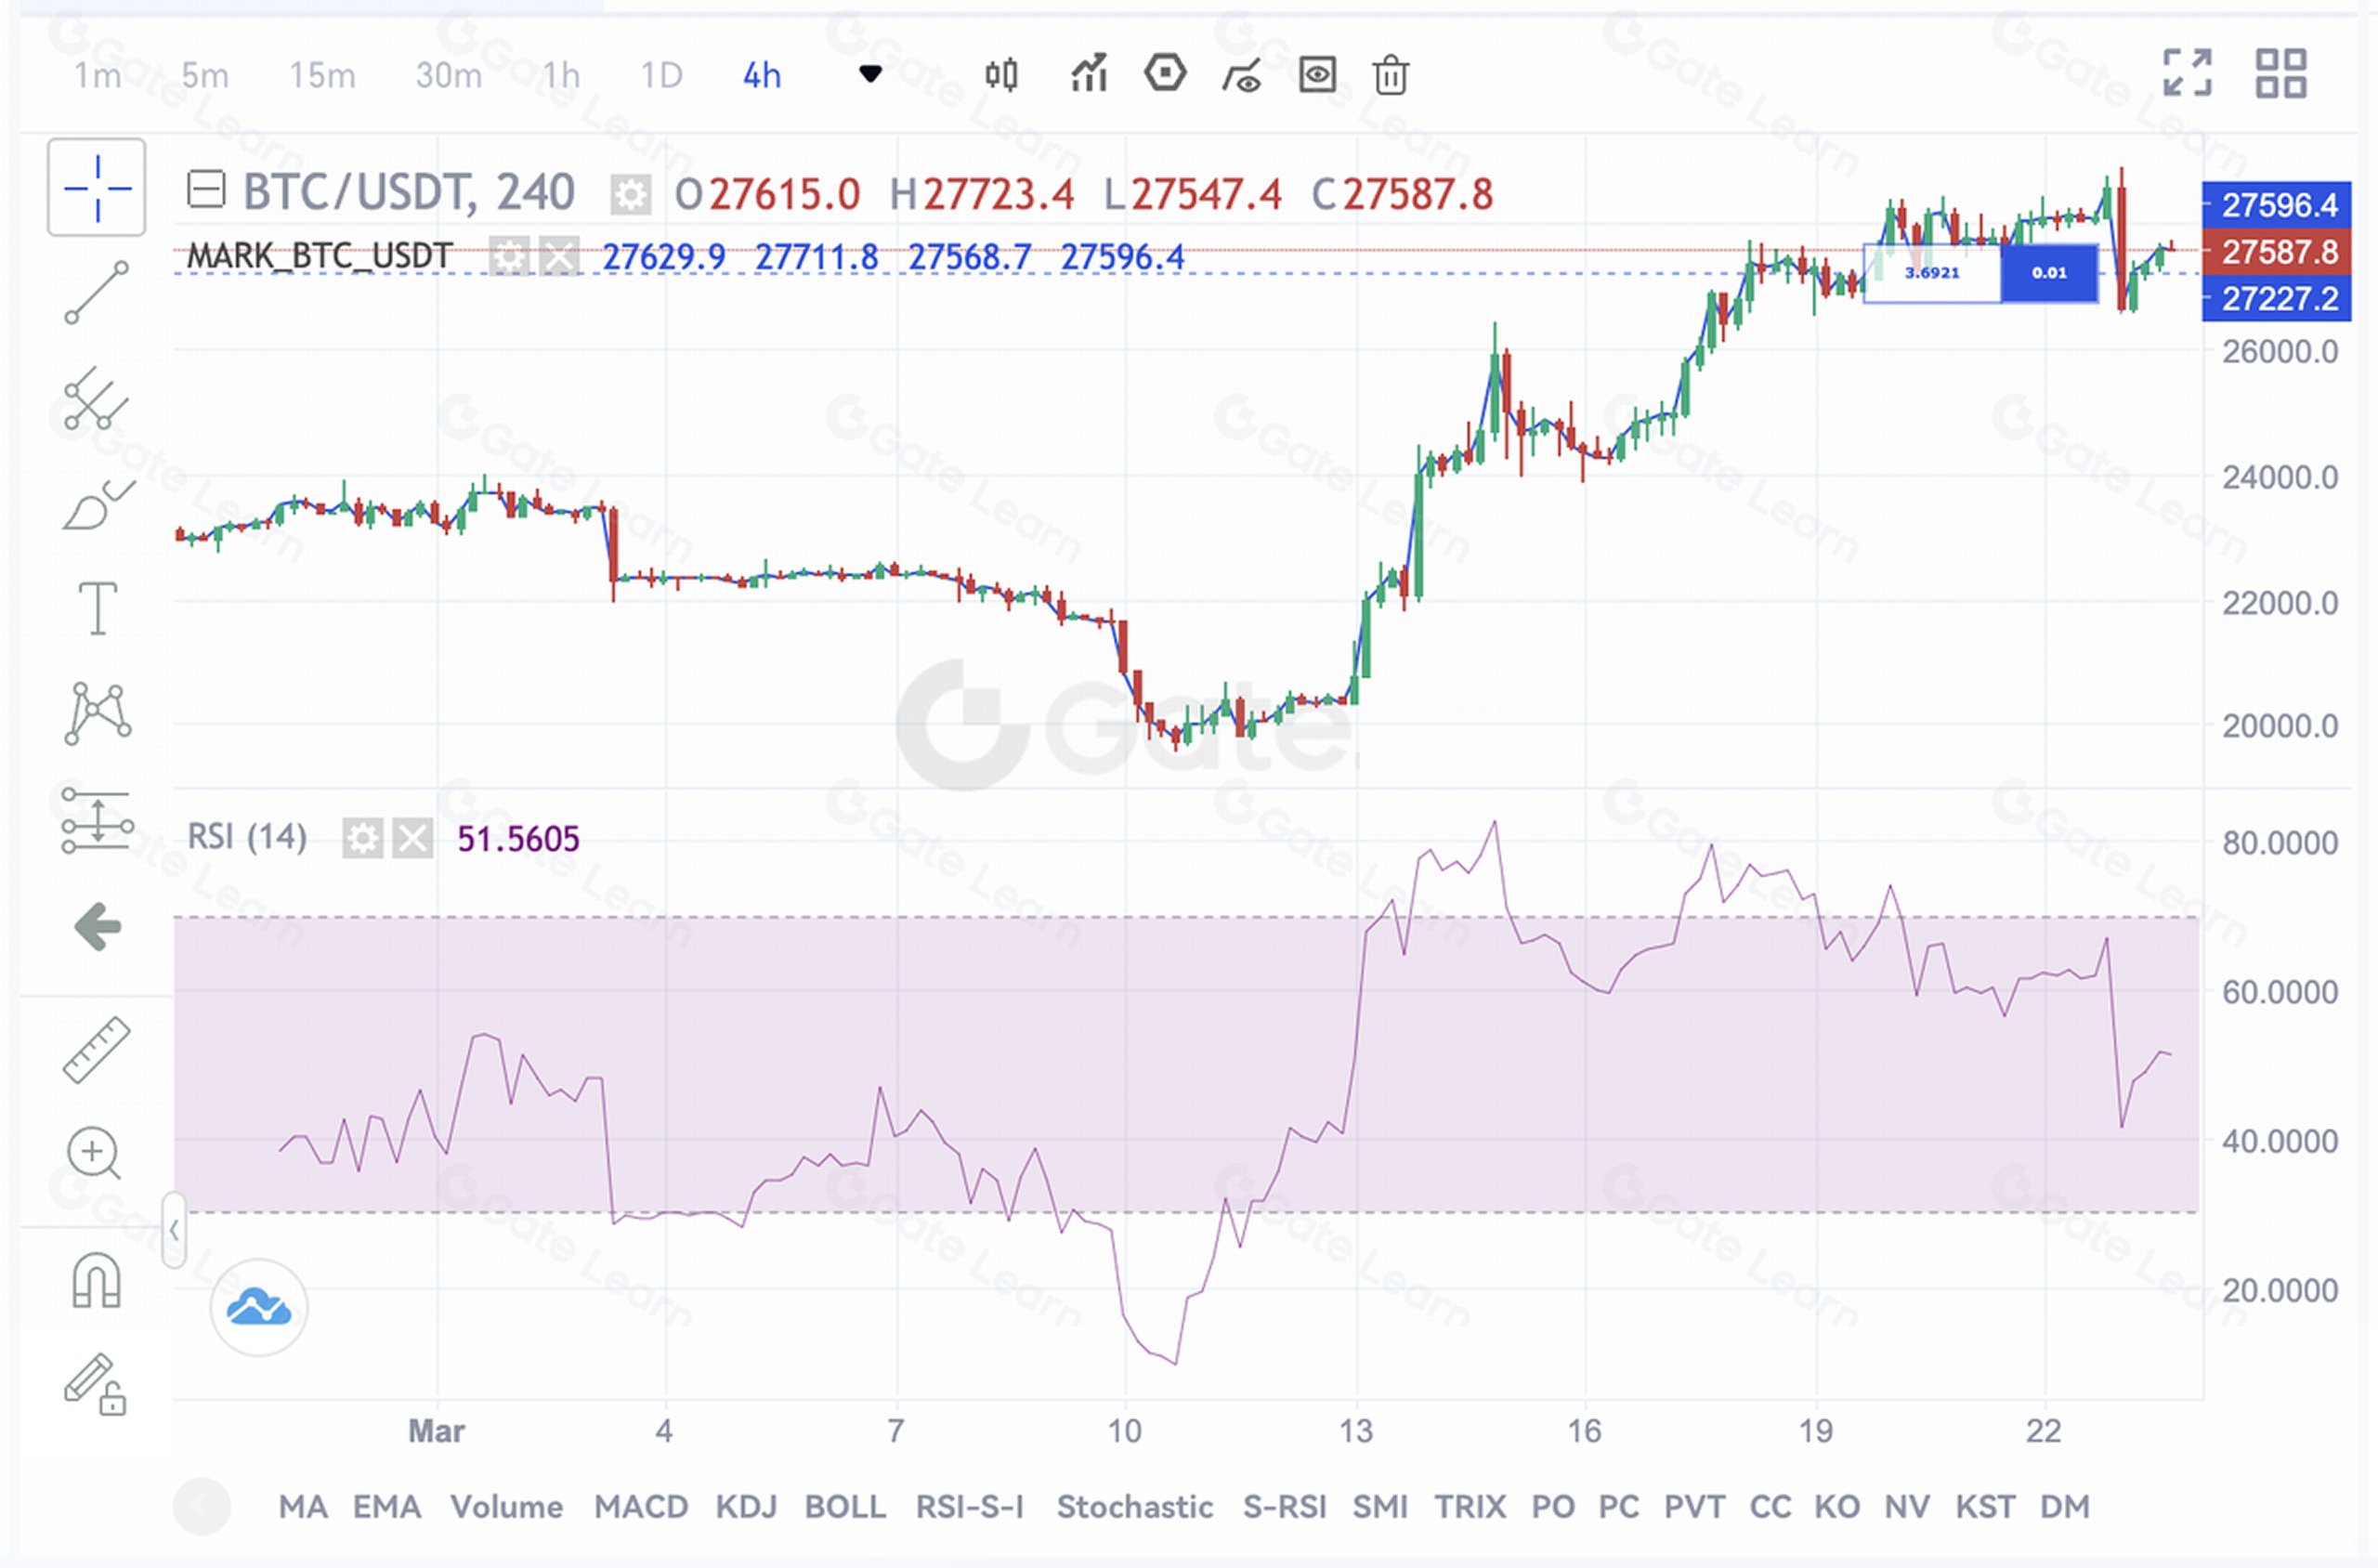
How the RSI line oscillates with the change in price:
- The greater the increased range in the relative price, the stronger the bullish mood is, and the closer the RSI line is to 100.
- The greater the decline range in the relative price, the stronger the bearish mood is, and the closer the RSI is to 0.
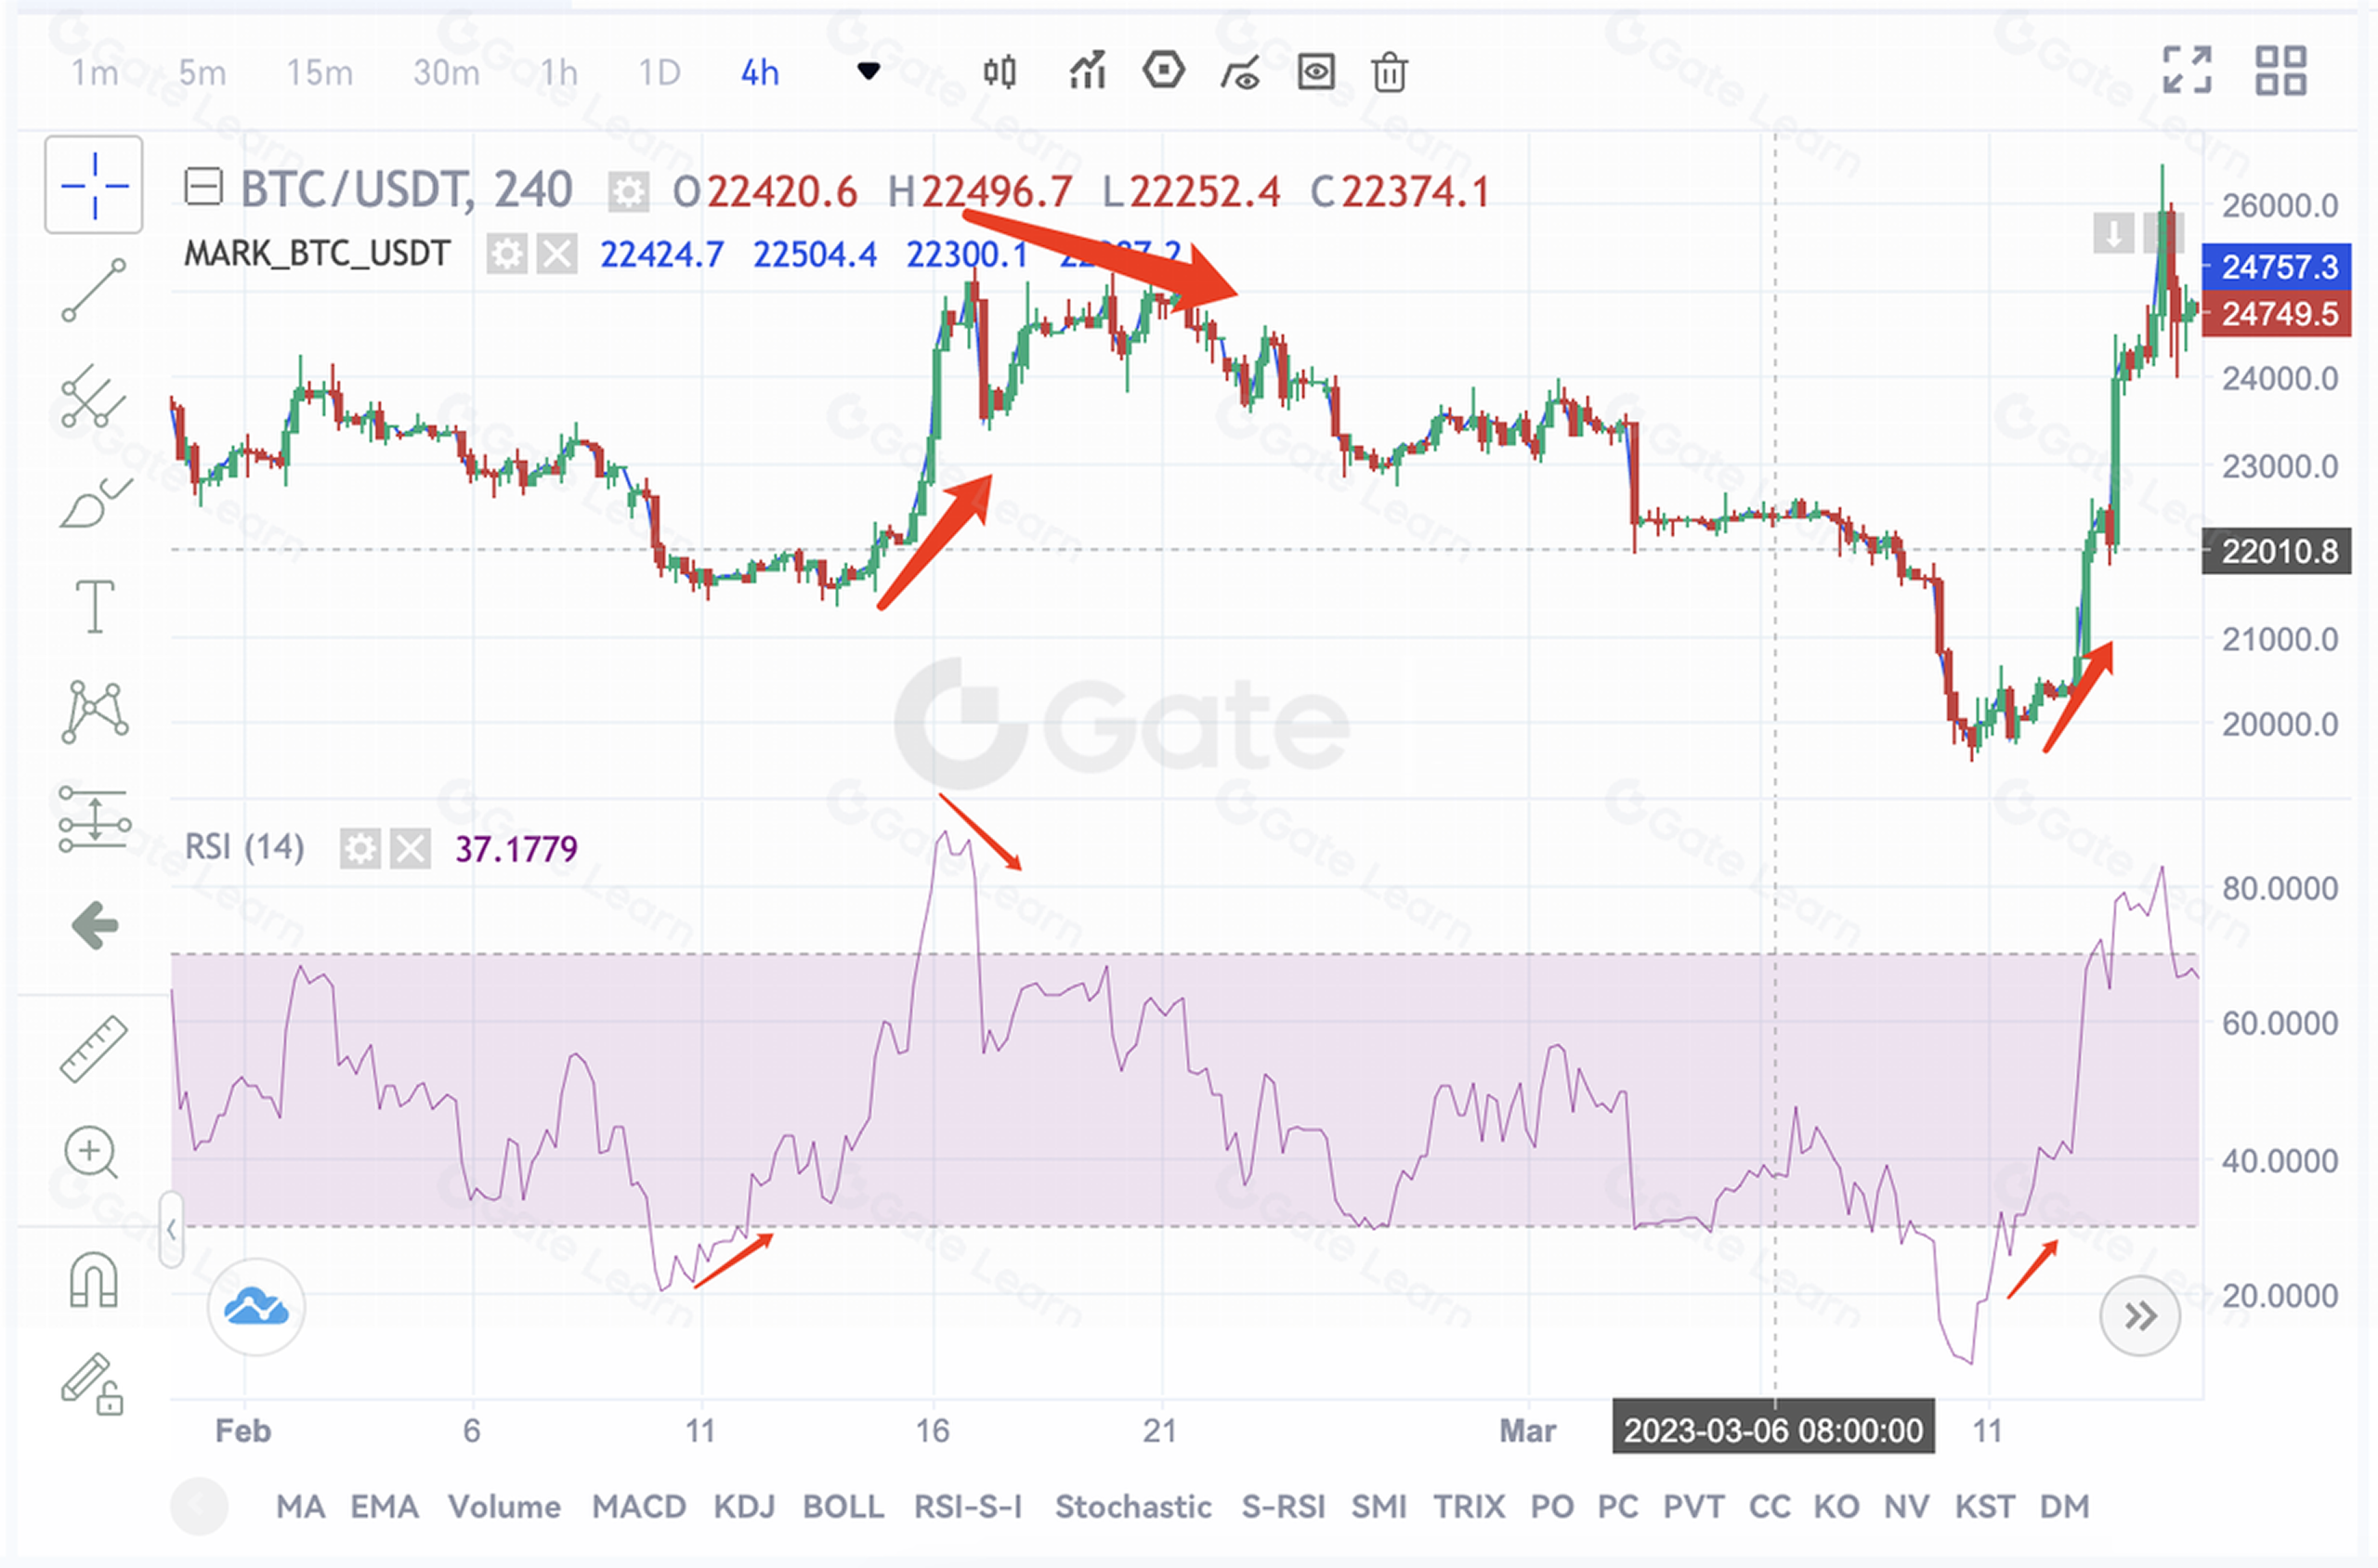
As shown in the figure above, the lower and upper horizontal dotted lines are called signal lines and are generally set to be between 30 and 70, respectively by default. The greater the difference between the two line values, the lower frequency yet the higher accuracy of the signals we can get.
The technical meaning of the RSI signal line:
- Overbought zone: between the range of 70 to 100;
- Oversold zone: between the range of 0 and 30;
- Bull-bear market dividing line: 50;
- When RSI is above 50, it indicates the price is likely to rise. Conversely, if the indicator falls below 50, it means the market may turn into a bearish trend.
Meanings of RSI
Draw horizontal and diagonal lines, and buy or sell when these lines are crossed. Place a horizontal line at the oscillator reference point; when the market changes its trend, the RSI indicator will typically signal slightly earlier than the actual case takes place:
1.Buy and sell assets when the line reaches the overbought and oversold zones
When the market is overheated and the number of buy and sell orders becomes imbalanced, it indicates that the trend is likely to reverse. A prudent approach for traders is to stop buying assets when the RSI rises above 70 and to stop selling when the RSI falls below 30. The optimal strategy is to confirm the trend using the RSI and trend indicators. Then, sell assets when the RSI reverses in the overbought zone, or buy more assets when the indicator turns in the oversold zone.
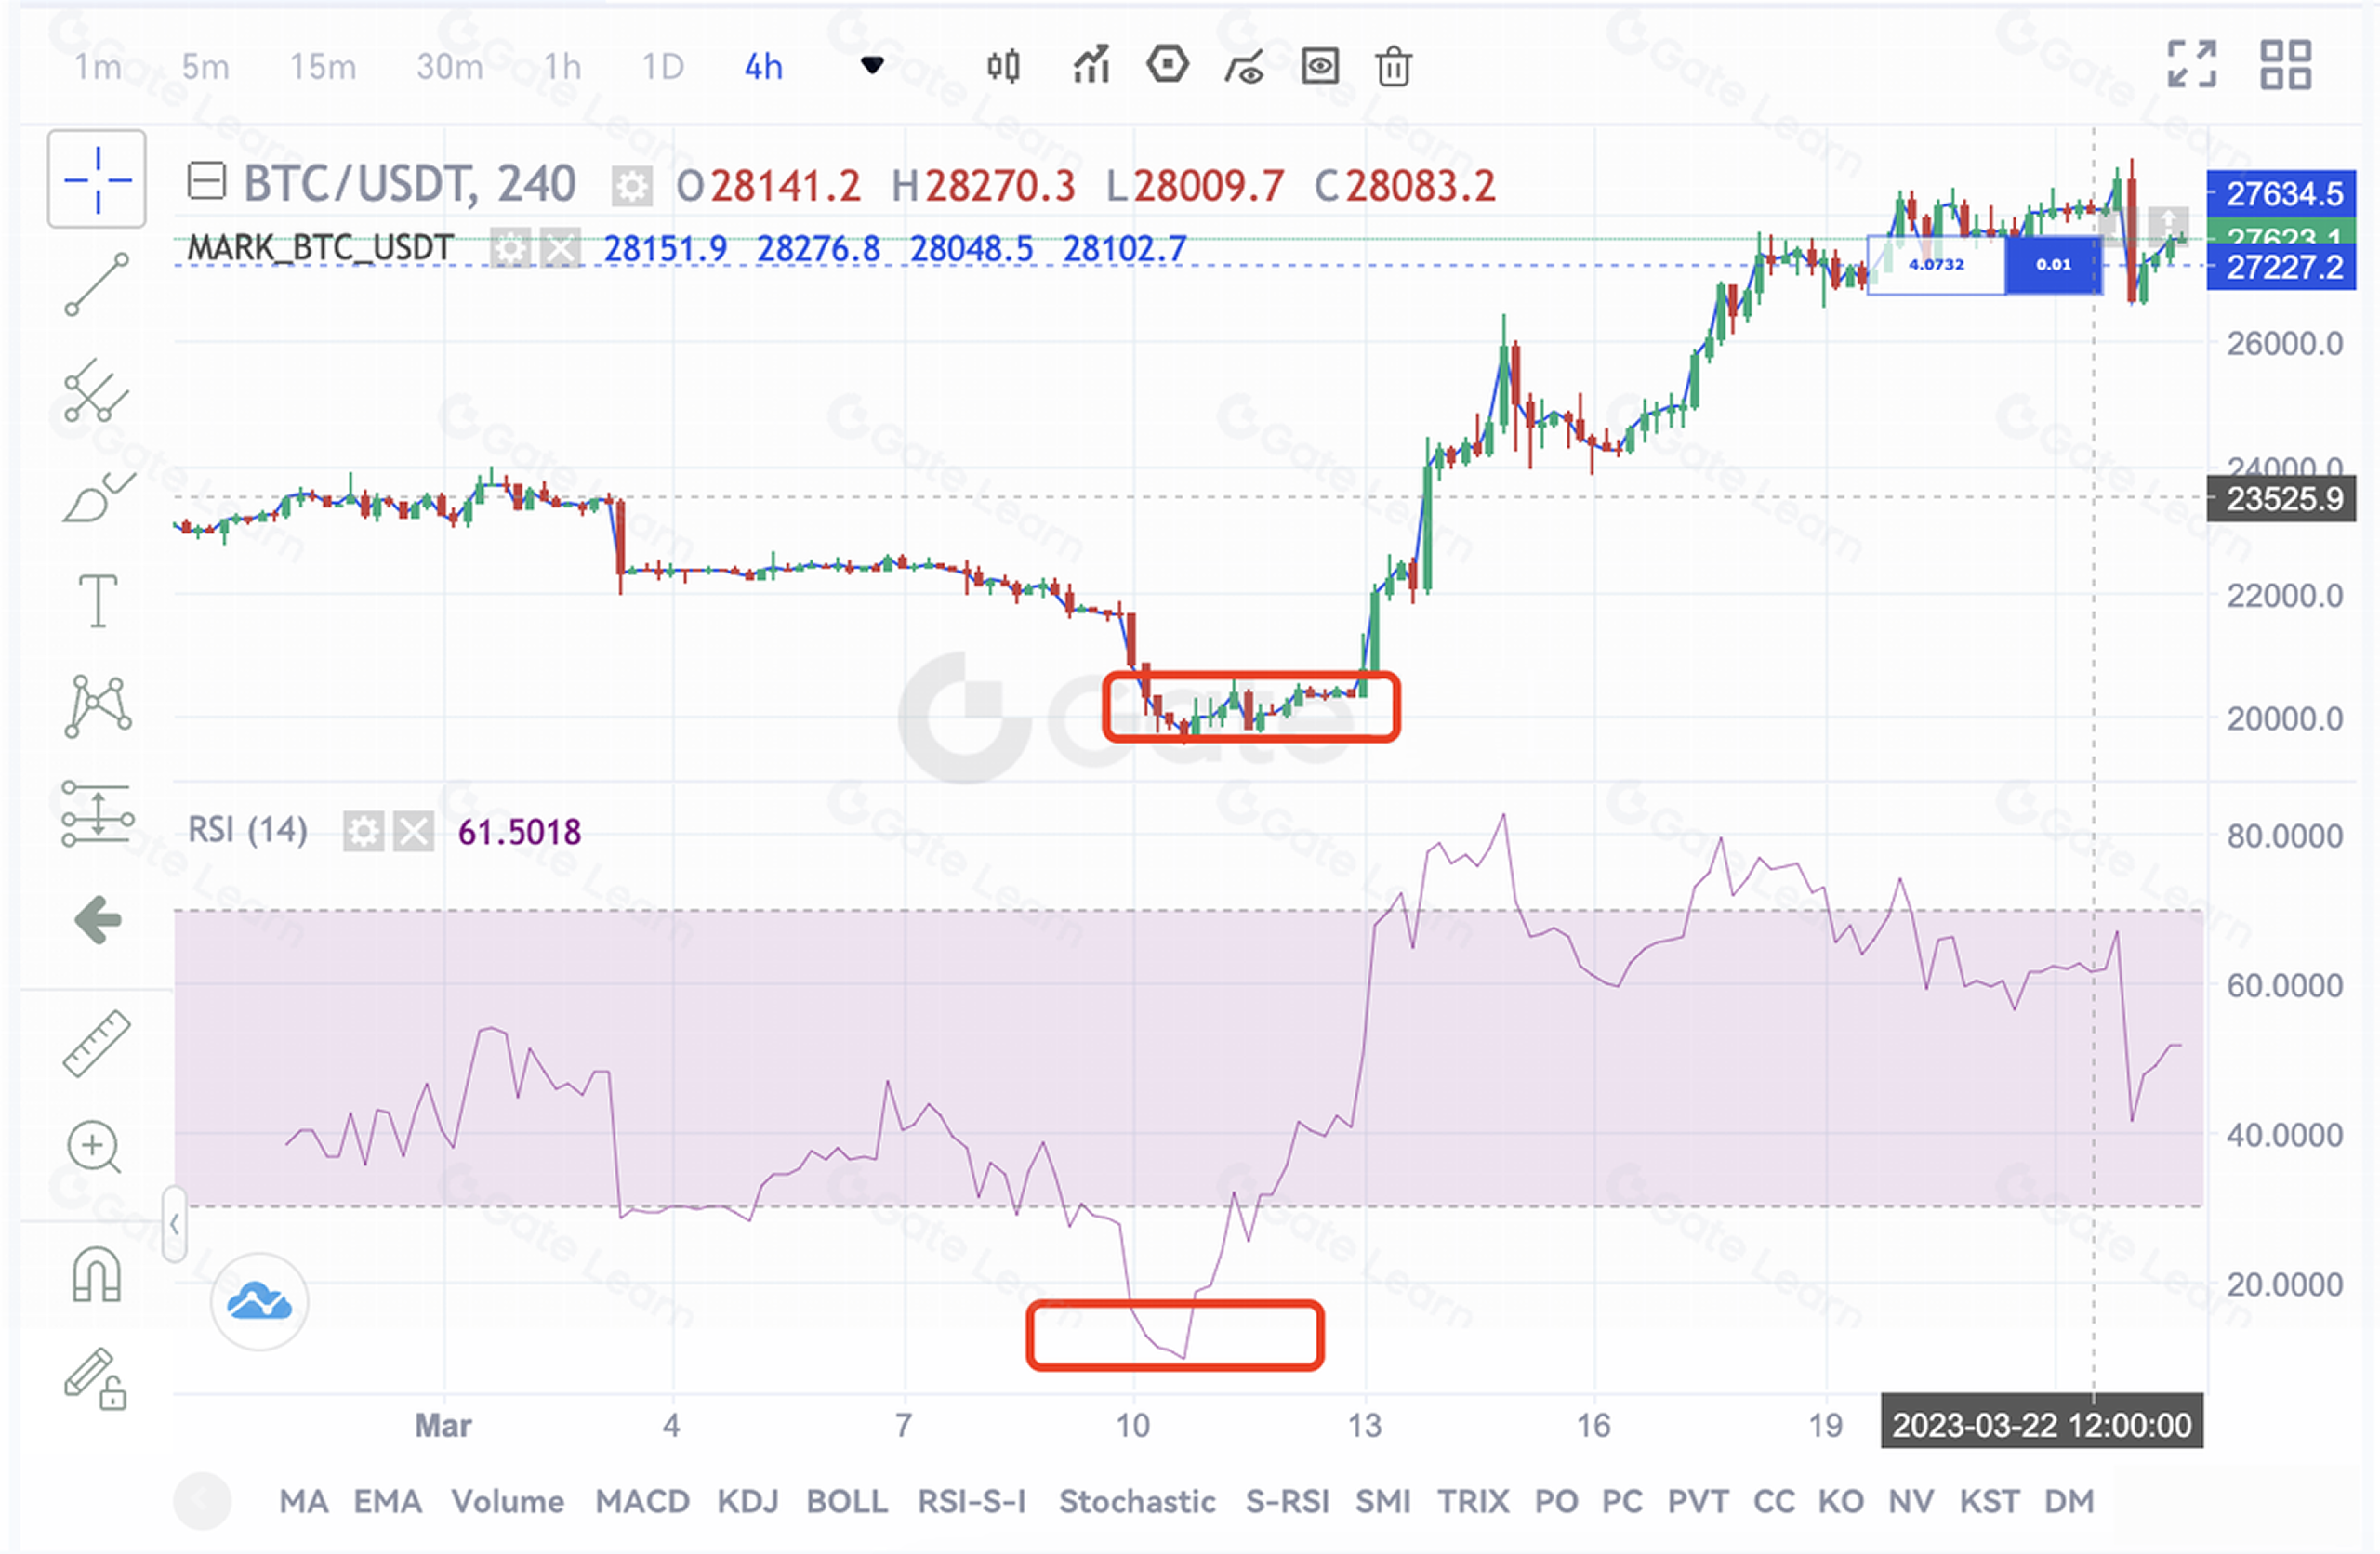
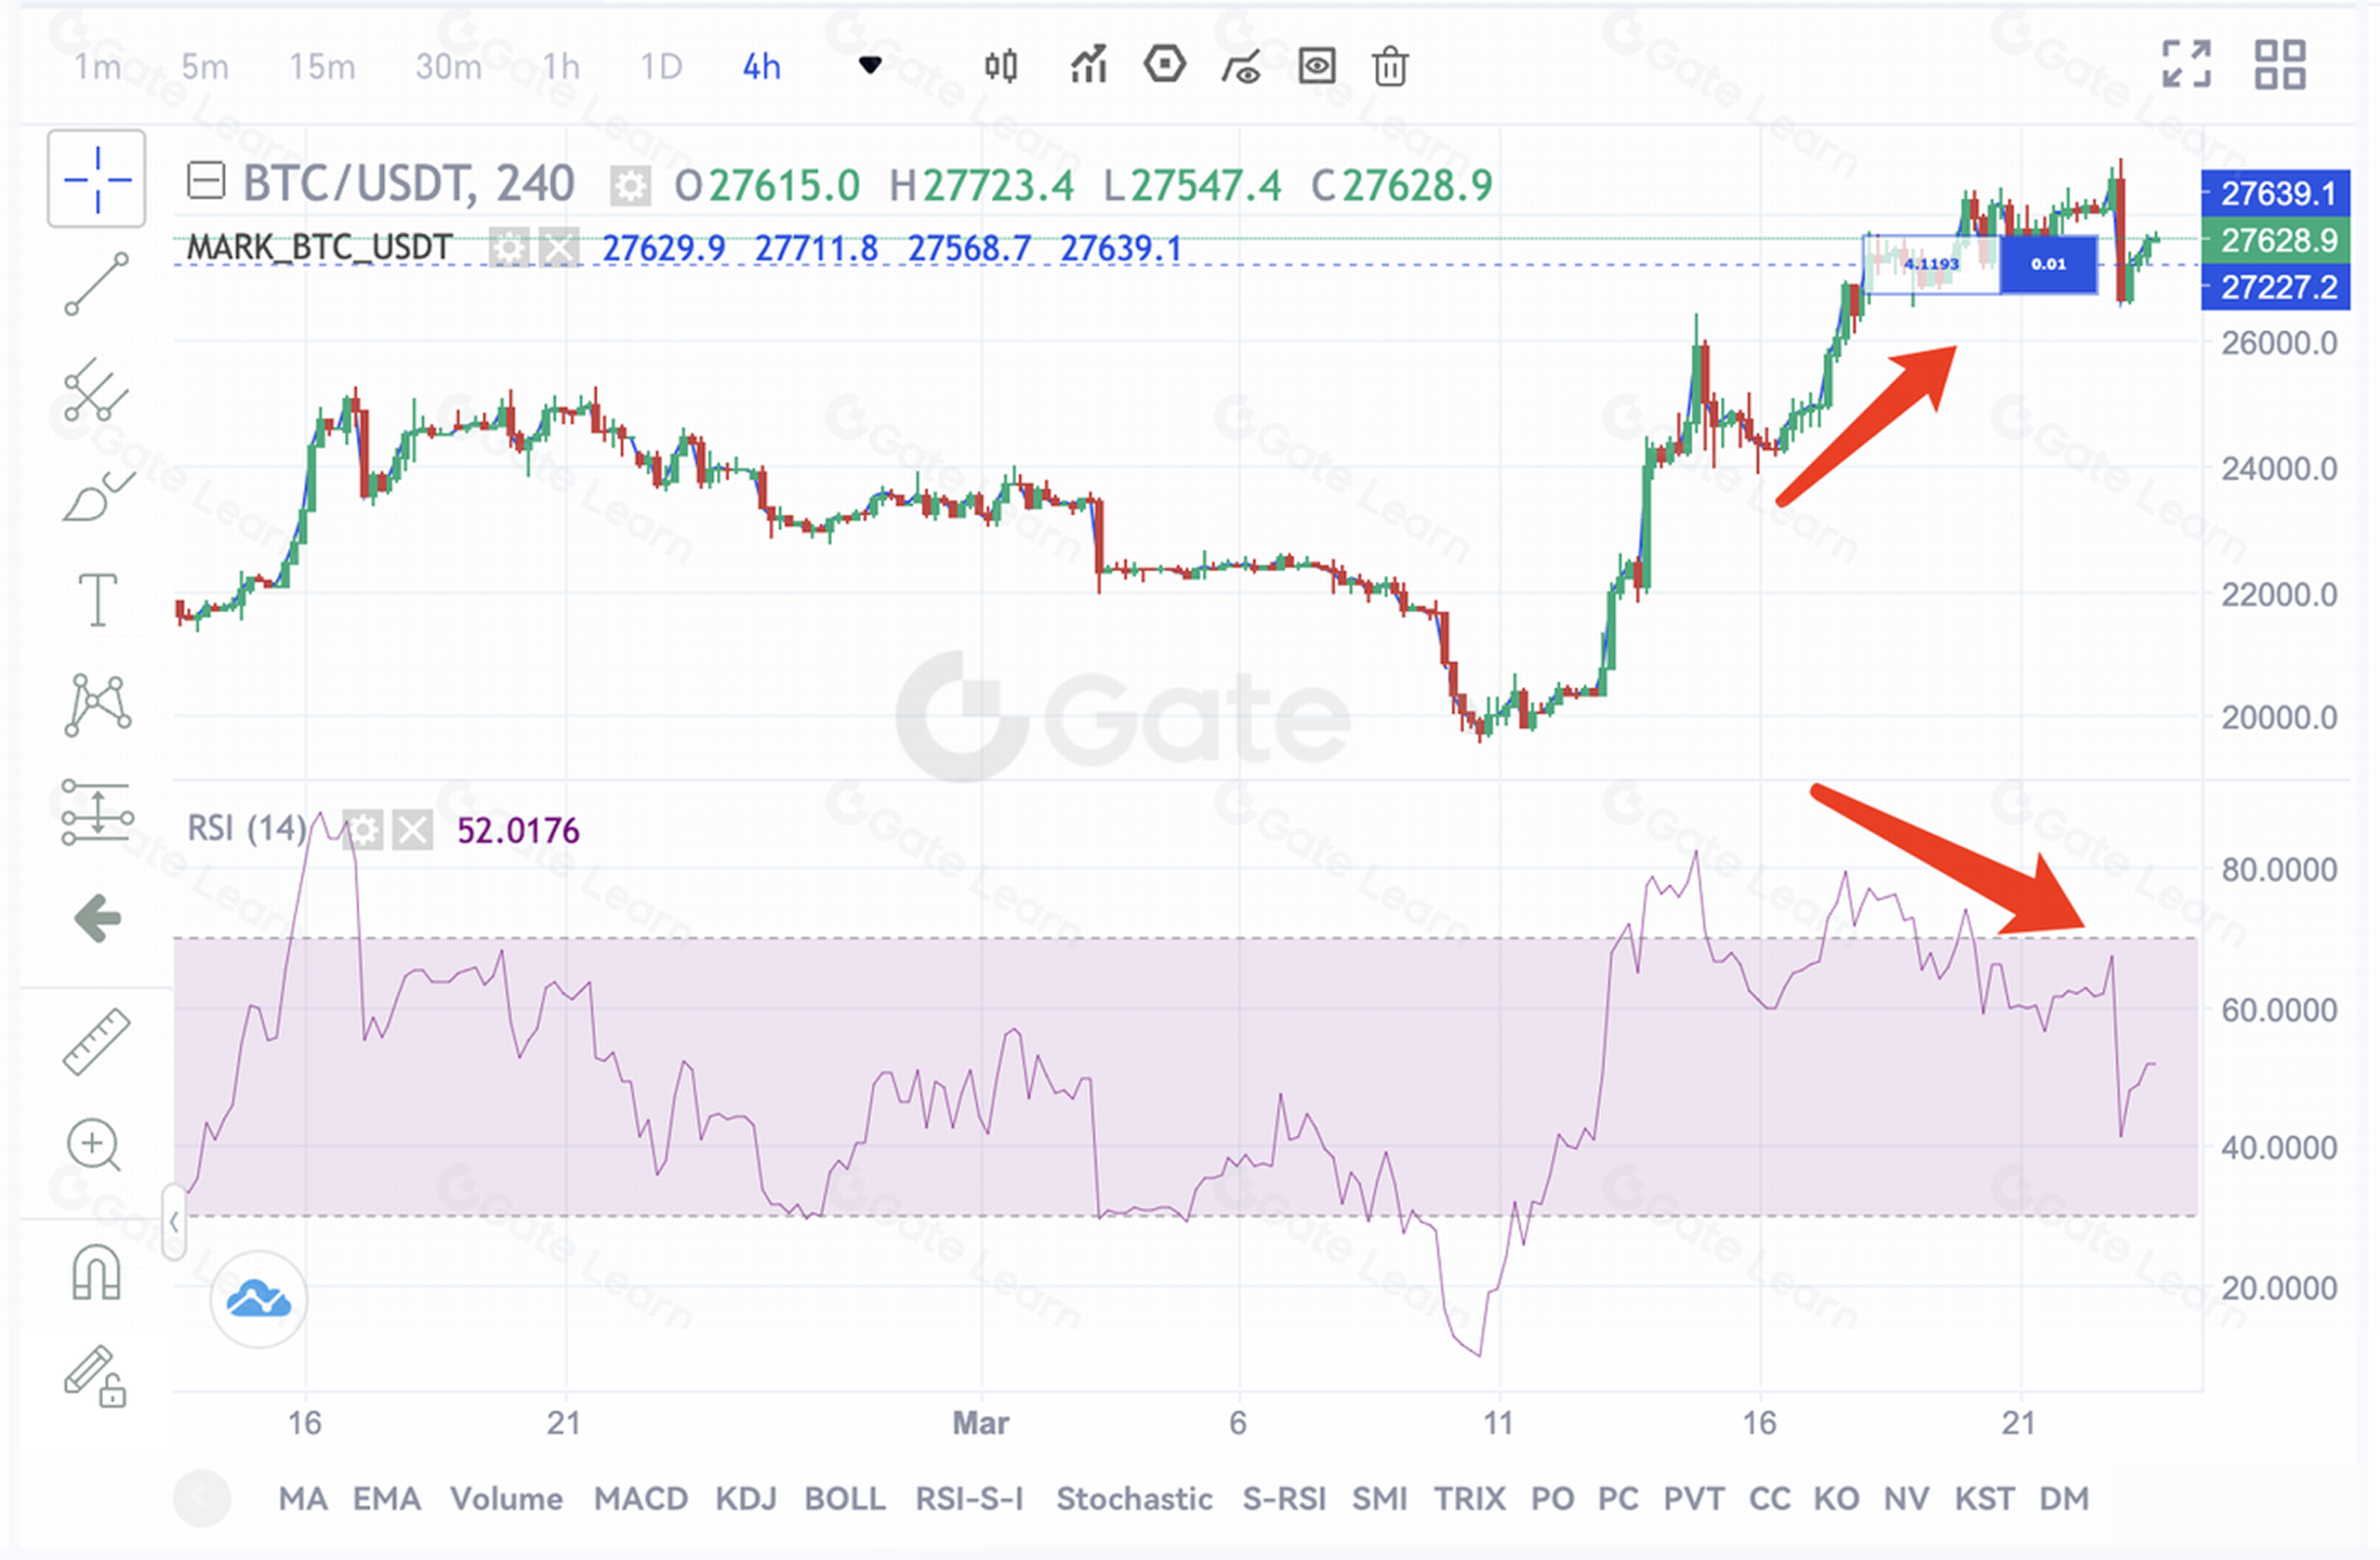
2.RSI Divergence
A divergence is formed when the indicator line goes in a direction opposite the K-line, which means that the trend may reverse.
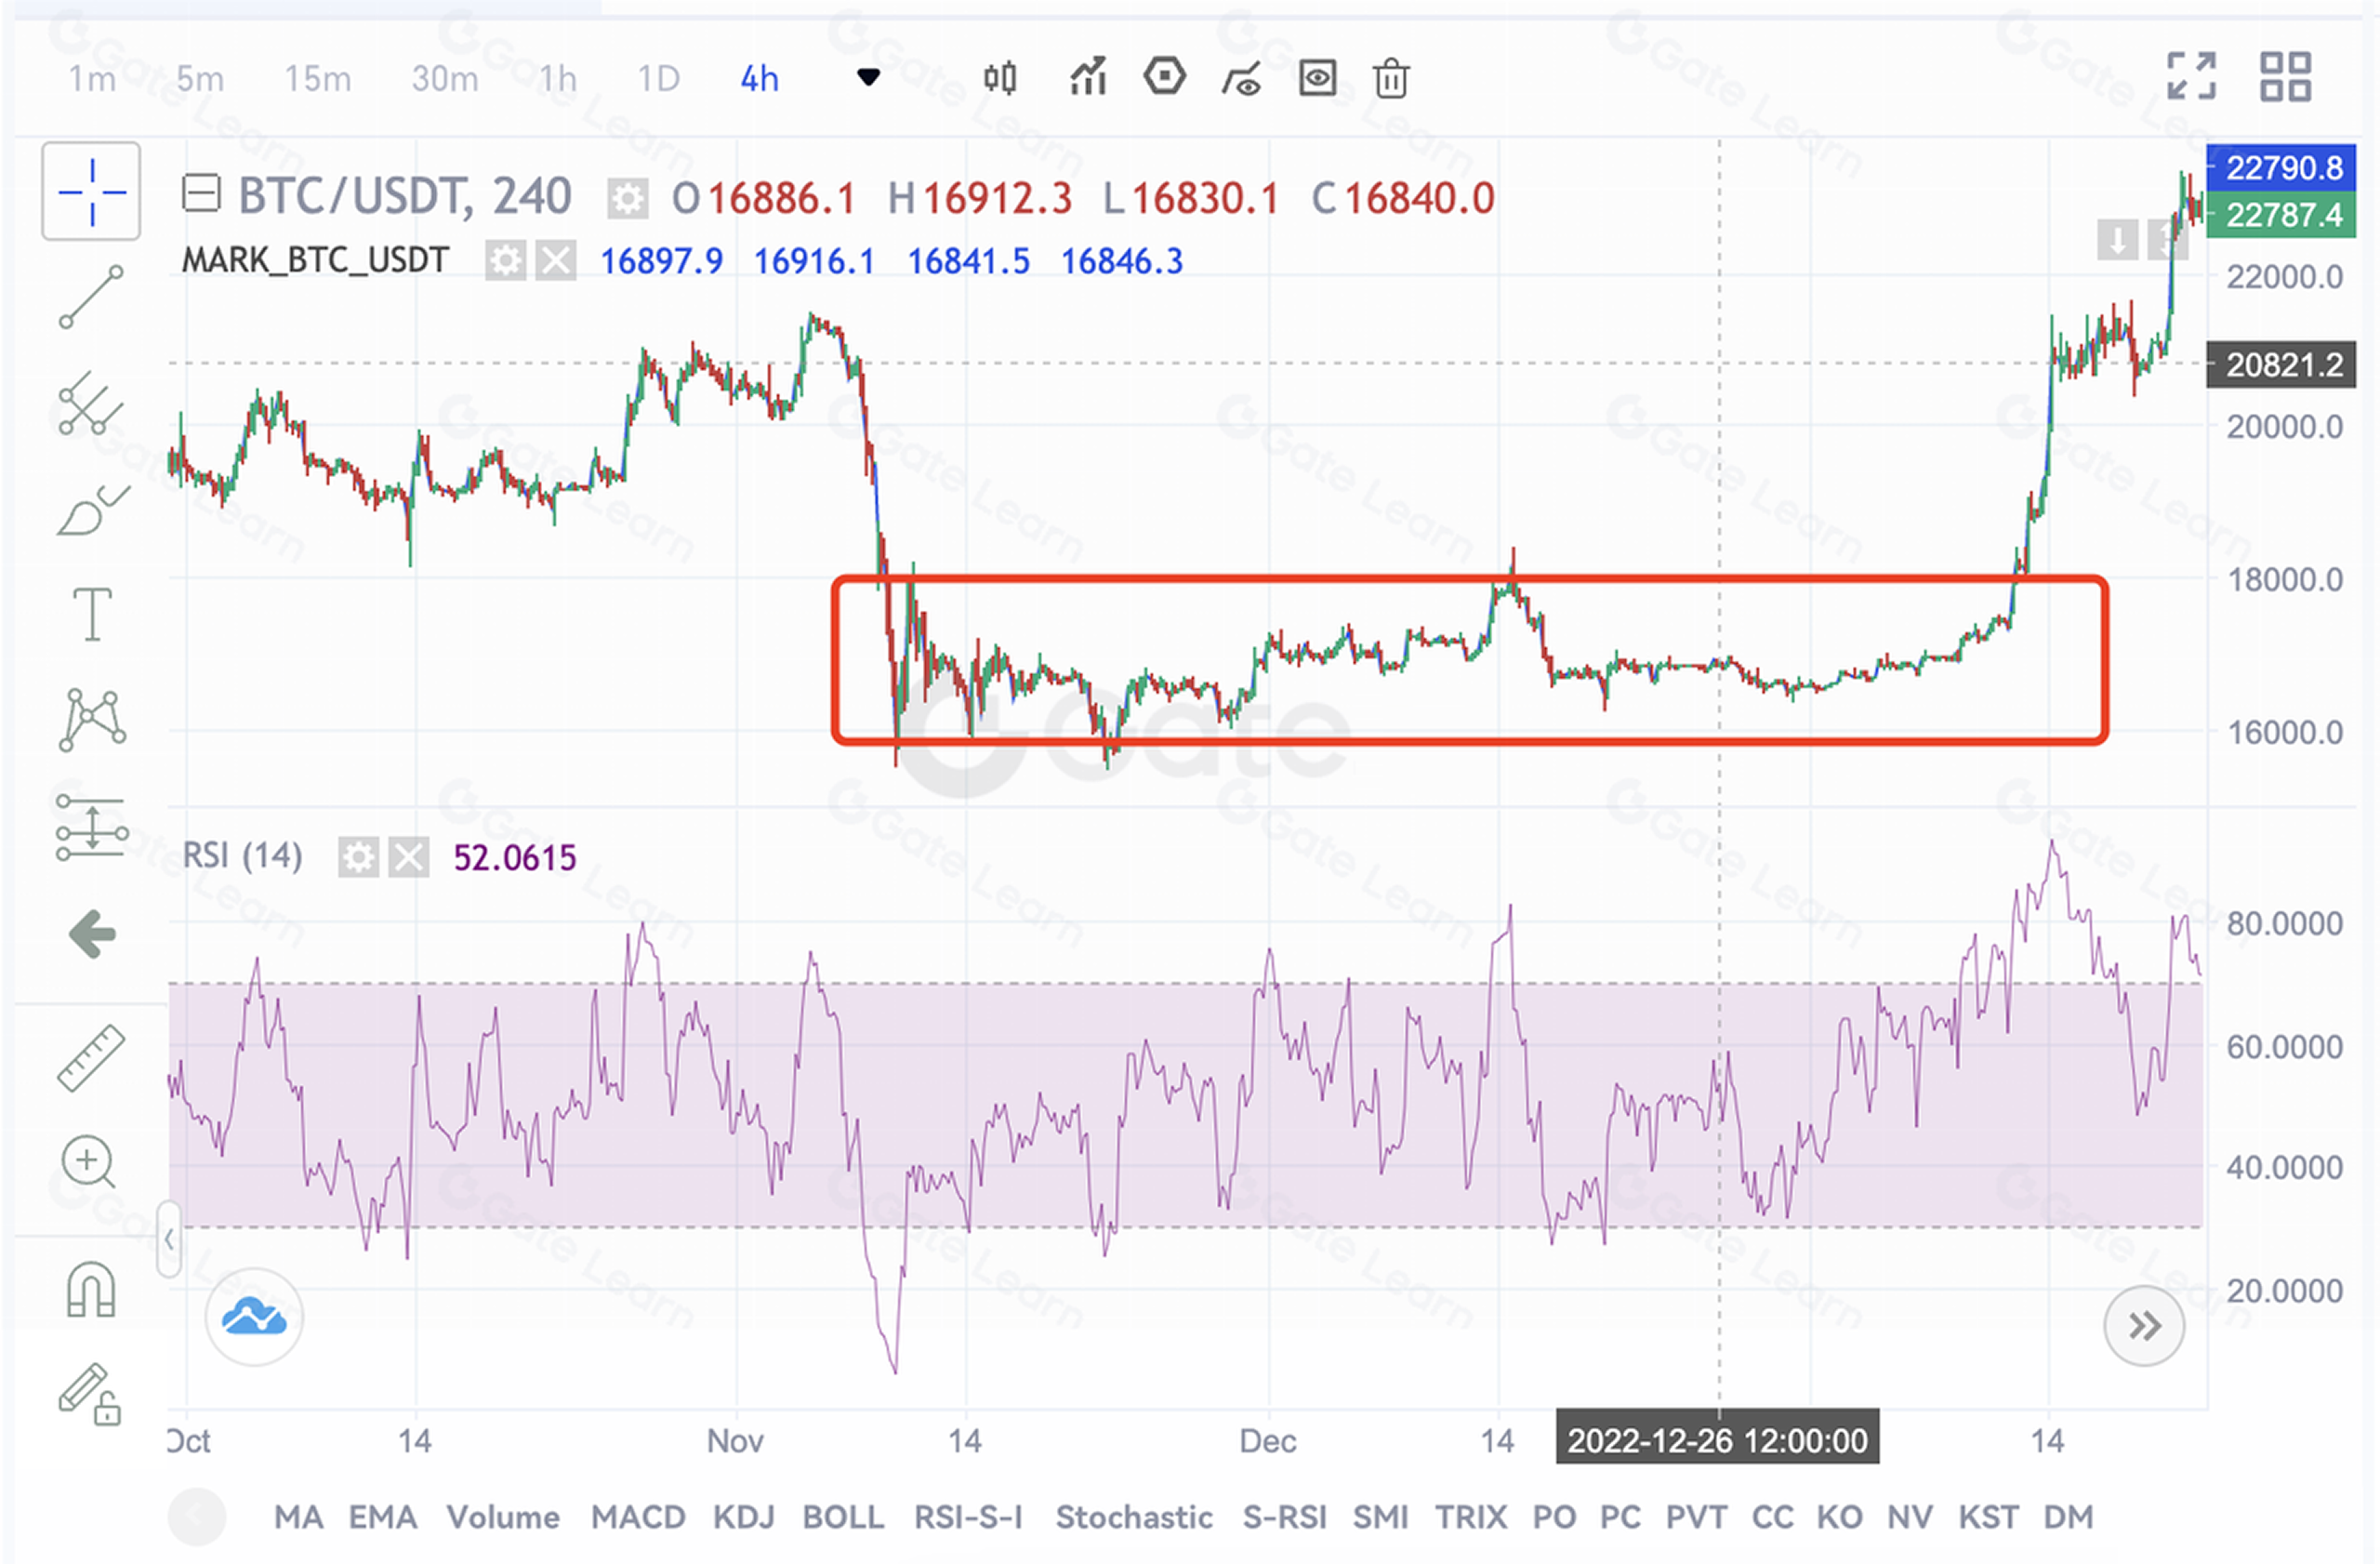
3.Horizontal movement
This happens when the oscillator draws an M or W pattern. You can hold up to the positions when the pattern is forming and subsisting, but start to buy more assets when the line breaks the signal level, and the trend corrects itself.
Reminder: The common flaw for all indicator analyses is that they reflect the market change with a delay. So, the RSI indicator can be mainly used as a supplement: use other technical tools to identify the trend, such as trend indicators, and technical forms, and use RSI to confirm the trend. Please do not rely on oscillator signals only, when you trade.
Use of RSI
As a prime indicator to read the trend strength, RSI is primarily used to confirm the timing of a trade. The value of the indicator varies from 0 to 100, and is set to be between 30 and 70 by default. As for the chart, the area between horizontal axises is the oversold zone, and the range between 70 and 100 is the overbought zone.
- RSI bull-bear dividing line
When the RSI index reverses in the overbought zone and falls below the 70 level, it is time to initiate short positions. When the RSI index reverses in the oversold zone and crosses above the 30 level, it suggests initiating long positions.
Summary
- RSI only signals towards possible movements of the market, and there is always a chance that this signal is wrong. To improve the success rate of trading, one should also use other technical indicators (such as moving averages) as a supplement to confirm the trend.
- RSI has no smoothness. So the indicator may become less effective during severe market fluctuations.
- RSI, as a ratio indicator, is not a suitable tool for judging the trend change. It can hardly give any trading signals when the market is experiencing horizontal movement, which would float the indicator’s value around 50.
Register on the Gate Futures platform to start trading!
Disclaimer
Please note that this article is for informational purposes only and does not offer investment advice. Gate cannot be held responsible for any investment decisions made. The information related to technical analysis, market judgment and trading skills should not be relied upon for investment purposes. Investing carries potential risks and uncertainties, and this article does not guarantee returns on any investment.
Lesson 1:Understanding The Moving Average
Lesson 2:Detailed Explanation of Granville 8 Rules
Lesson 3:Application of single moving average
Lesson 4:Application of Double Moving Average
Lesson 5:Application of Moving Average Array - Long Pattern
Lesson 6:Application of Moving Average Array - Short Pattern
Lesson 7:How to use Moving Average Patterns - Moving Average Cross
Lesson 8:How to Use Moving Average Patterns - Moving Average Bonding, Convergence and Divergence
Lesson 9:What is trend trading?
Lesson 10:What is the left-side and right-side trading
Lesson 11:What is the trend line
Lesson 12:How to Use Trend Line
Lesson 13:Support line and resistance line
Lesson 14:Application of MACD - the King of Indicators
Lesson 15:Application of Oscillating Indicator-KDJ
Lesson 16:Application of Relative Strength Indicator - RSI
Related Courses

Technical analysis: A useful tool to understand trends in Futures trading

Gate Simple Earn Investment Guide

Gate Futures Trading Guide - A must-read for newbies

Crypto Infolw : Coin , Data and News
ETF Leveraged Tokens — Product Guide
