Trade
Basic
Futures
Futures
Hundreds of contracts settled in USDT or BTC
Options
HOT
Trade European-style vanilla options
Unified Account
Maximize your capital efficiency
Demo Trading
Futures Kickoff
Get prepared for your futures trading
Futures Events
Participate in events to win generous rewards
Demo Trading
Use virtual funds to experience risk-free trading
Earn
Launch
CandyDrop
Collect candies to earn airdrops
Launchpool
Quick staking, earn potential new tokens
HODLer Airdrop
Hold GT and get massive airdrops for free
Launchpad
Be early to the next big token project
Alpha Points
NEW
Trade on-chain assets and enjoy airdrop rewards!
Futures Points
NEW
Earn futures points and claim airdrop rewards
Investment
Simple Earn
Earn interests with idle tokens
Auto-Invest
Auto-invest on a regular basis
Dual Investment
Buy low and sell high to take profits from price fluctuations
Soft Staking
Earn rewards with flexible staking
Crypto Loan
0 Fees
Pledge one crypto to borrow another
Lending Center
One-stop lending hub
VIP Wealth Hub
Customized wealth management empowers your assets growth
Private Wealth Management
Customized asset management to grow your digital assets
Quant Fund
Top asset management team helps you profit without hassle
Staking
Stake cryptos to earn in PoS products
Smart Leverage
NEW
No forced liquidation before maturity, worry-free leveraged gains
GUSD Minting
Use USDT/USDC to mint GUSD for treasury-level yields
More
CryptoAnalyZen
No content yet
CryptoAnalyZen
$TRX — 2026 outlook
TRX is currently 6th in the TOP-20 CMC Index.
After a major rally in 2024 that set a new ATH of 0.4500, the price spent last year trading in a wide range, testing 23% Fibonacci of the 2024 yearly move, and moving slightly above 50% of the yearly candle tail.
Right now, direction is uncertain, but a rejection structure may be forming.
If this plays out, price could break below the 2026 and 2025 opens and move toward the annual gap zone between 0.2011 and 0.18, which also aligns with the 62% Fibonacci retracement of the 0.0068–0.45 range.
#TRX #trx #tron
TRX1,15%

- Reward
- like
- Comment
- Repost
- Share
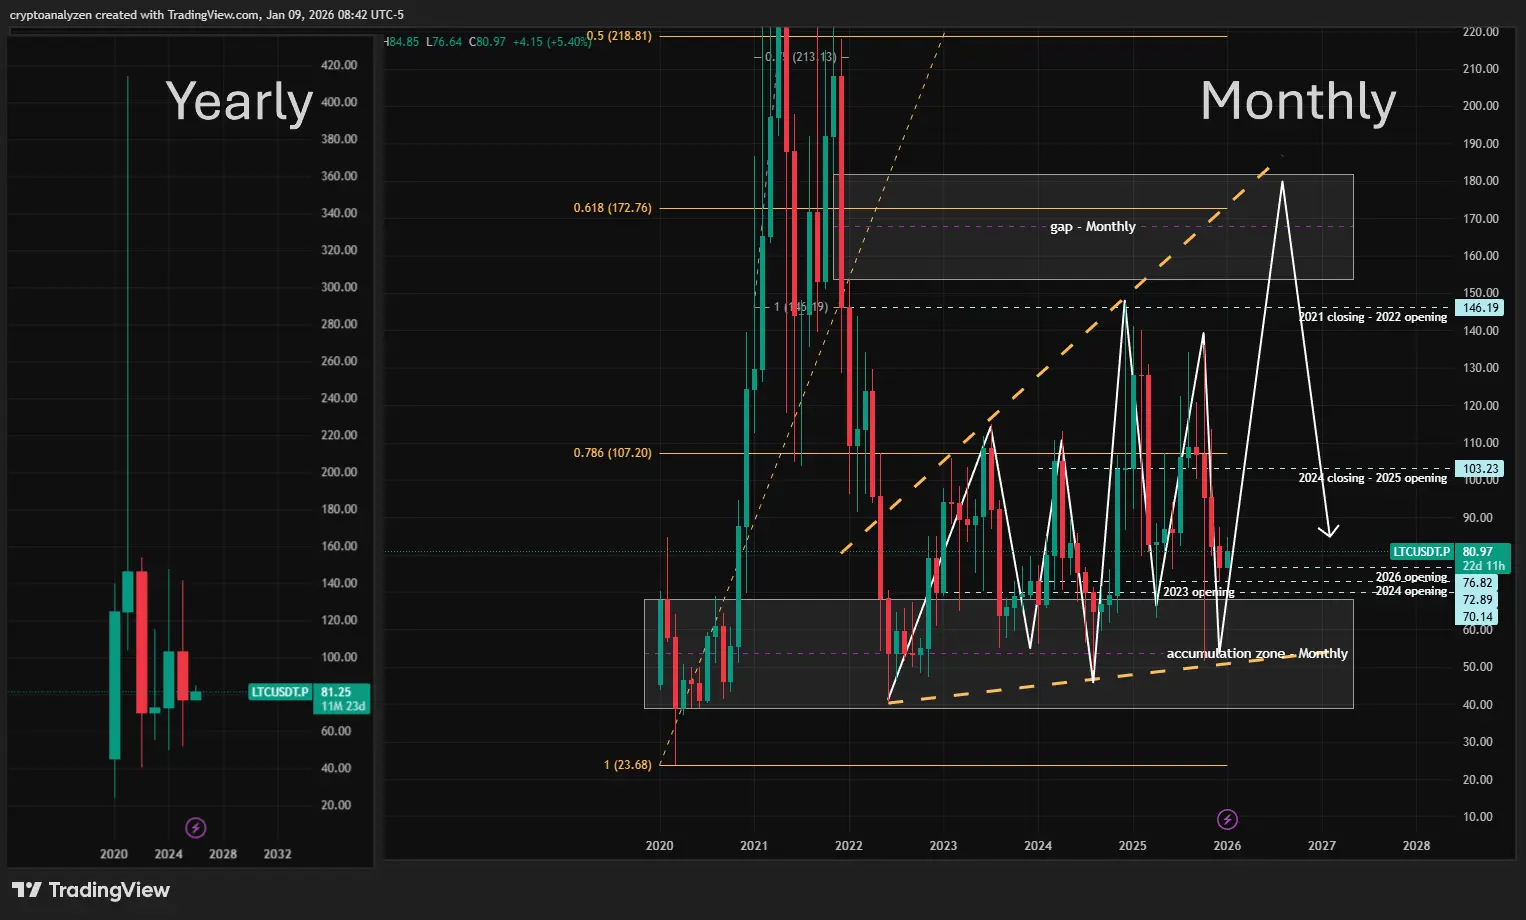
$LTC – 2026 outlook
LTC currently holds 15th place in the TOP-20 CMC Index, keeping it on my watchlist.
After the ATH in May 2021 (413.94) and the following decline, the price is still trying to “fight gravity,” but it has been unable to break above the 2022 opening price at 146.19.
On the monthly chart, an expanding triangle pattern is visible, formed around the 2020–2021 accumulation zone.
If the pattern repeats, the next wave could push price higher into the gap between 181.91 and 153.79, aligning with the 62% Fibonacci level of the 23.68–413.94 range.
For now, I would like to see:
• a tes
LTC0,29%
- Reward
- like
- Comment
- Repost
- Share
- Reward
- like
- 1
- Repost
- Share
CryptoAnalyZen:
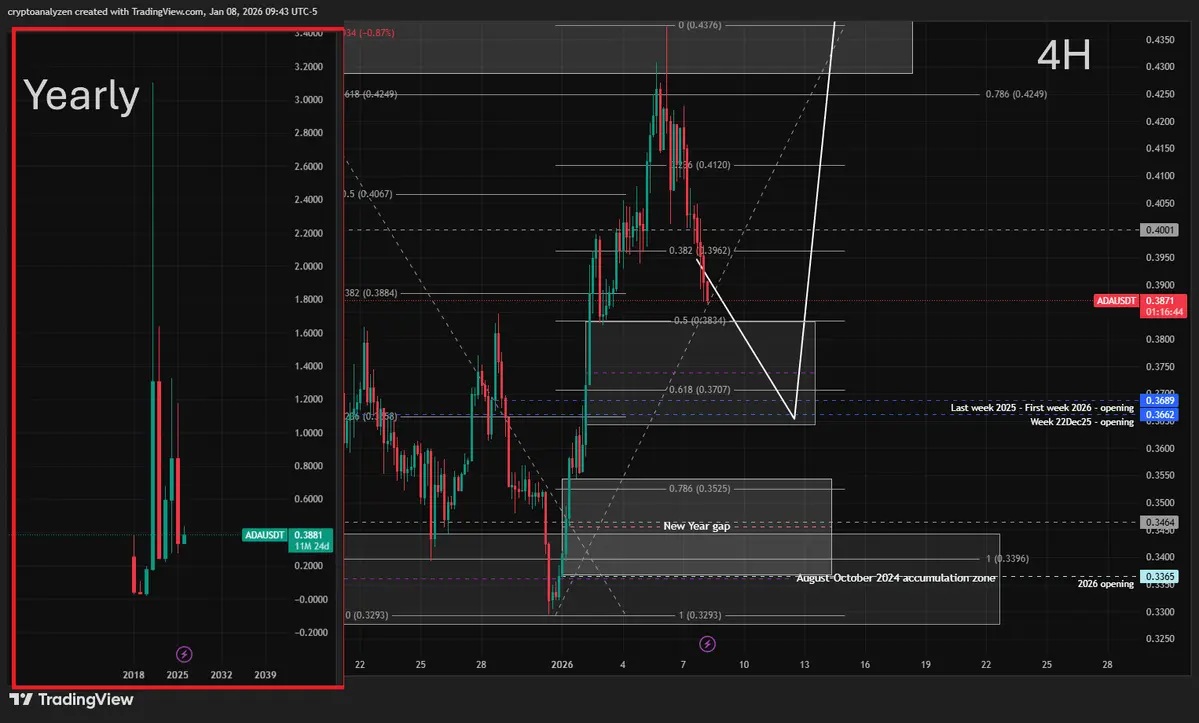
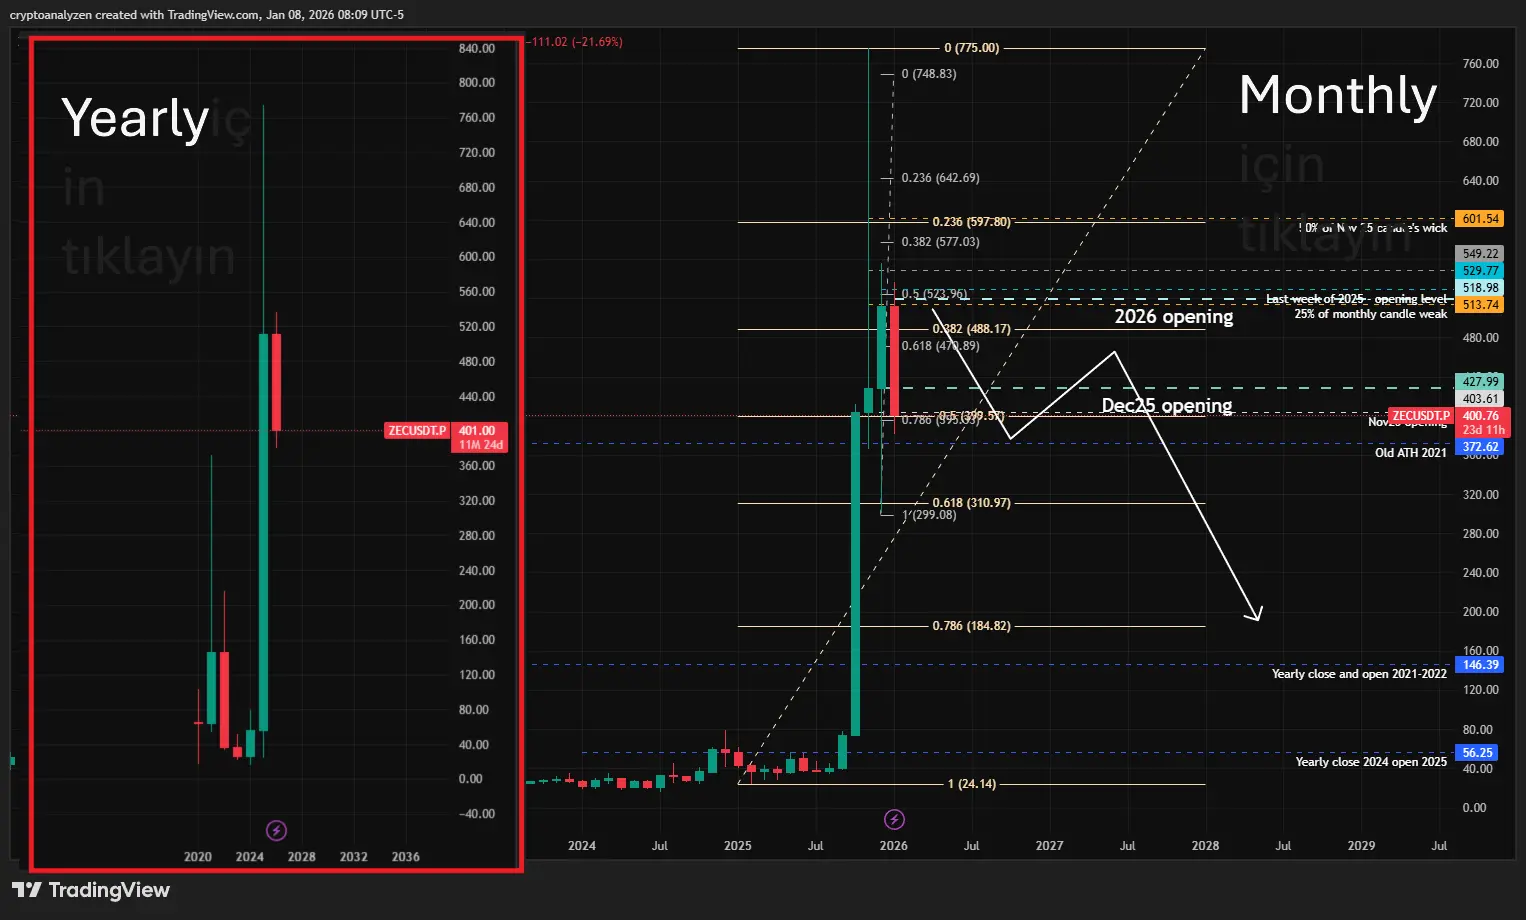
Ideally, we want the gap filled within the 50–62% Fibonacci zone of 0.32–0.43. For bullish continuation, price should not drop back into the New Year gap. If downside resumes, watch: • 0.2737 (2025 low) • 0.2458 (2023 open) • 0.1069–0.22 gap zone$ZEC update – annual & monthly perspective
$ZEC moved in correlation with Bitcoin: after distribution slightly above the 2026 opening level, price started to fall rapidly — the first expected scenario has now played out.
From 446, open interest increased significantly while price declined sharply, and funding remained strongly positive. This suggests opening of large longs and closing of large shorts.
The decline stopped near the old ATH at 372.62 (2021).
If the move continues downward, the key annual levels I’m watching are:
216.56 — 2022 high
146.38 — 2021 close / 2022 open
On the monthly c
ZEC-3,57%
MC:$3.97KHolders:1
0.00%
- Reward
- like
- Comment
- Repost
- Share
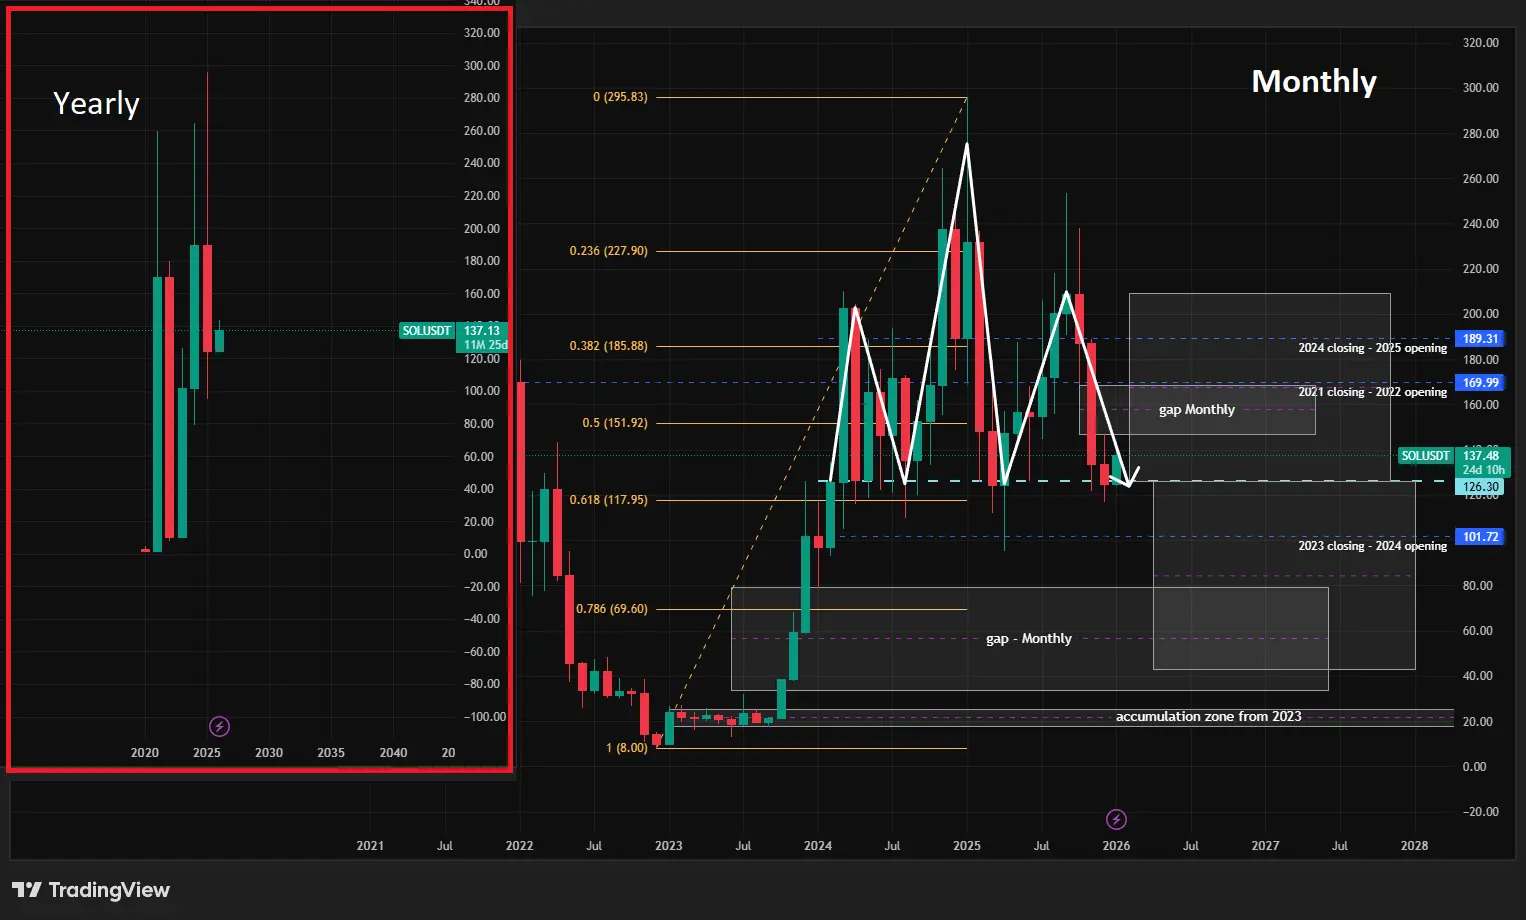
$SOL update – annual and monthly structure
Previously, my outlook for Solana was more optimistic, expecting higher prices toward the end of 2025. At present, the technical picture looks more dramatic.
On the annual chart, SOL usually forms very wide yearly ranges. The 2025 red candle with an ATH at 295.83 weakens the bullish case.
On the monthly chart, a clear head-and-shoulders structure is visible, with the neckline around 126.30. The downside projection of the last shoulder intersects with the gap zone and suggests potential continuation below the 78% Fibonacci retracement of the 8.00–295.
SOL-1,18%
- Reward
- like
- Comment
- Repost
- Share