Date: Sun, Dec 21 2025 | 10:26 AM GMT
The broader cryptocurrency market has continued to struggle with uneven and choppy price action over the past several weeks, a phase that began after the sharp sell-off on October 10. That correction pushed Ethereum (ETH) lower by nearly 26% over the last 60 days, keeping sustained pressure across the altcoin market. **Stellar (XLM) **has been no exception, remaining under selling pressure as risk appetite across the sector stays muted.
**XLM **is down more than 29% over the past two months, but beneath the surface, the weekly chart is starting to reveal a technical structure that could lay the groundwork for a potential rebound if key levels continue to hold.
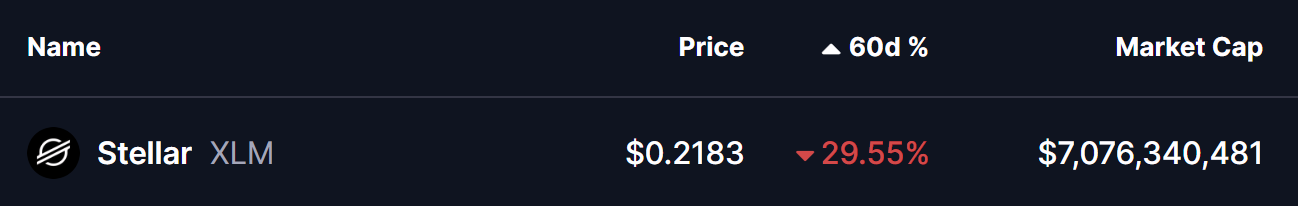
Source: Coinmarketcap
Descending Triangle Structure Comes Into Focus
On the weekly timeframe, XLM has been trading within a large descending triangle formation. This pattern is defined by a series of lower highs pressing against a relatively flat support base, reflecting consistent selling pressure from the top while buyers defend the same demand zone below. While descending triangles are often viewed as bearish continuation structures, repeated defenses of the base can also precede sharp upside reactions, particularly when broader market sentiment is already pessimistic.
The chart shows XLM once again pulling back into the critical $0.20–$0.22 support region. This zone has acted as a reliable demand area throughout the year, with each visit producing long lower wicks and swift reactions from buyers. These candle structures suggest that accumulation is taking place, even as price continues to respect the descending trendline from above. Despite months of pressure, sellers have so far been unable to force a decisive breakdown below this floor.
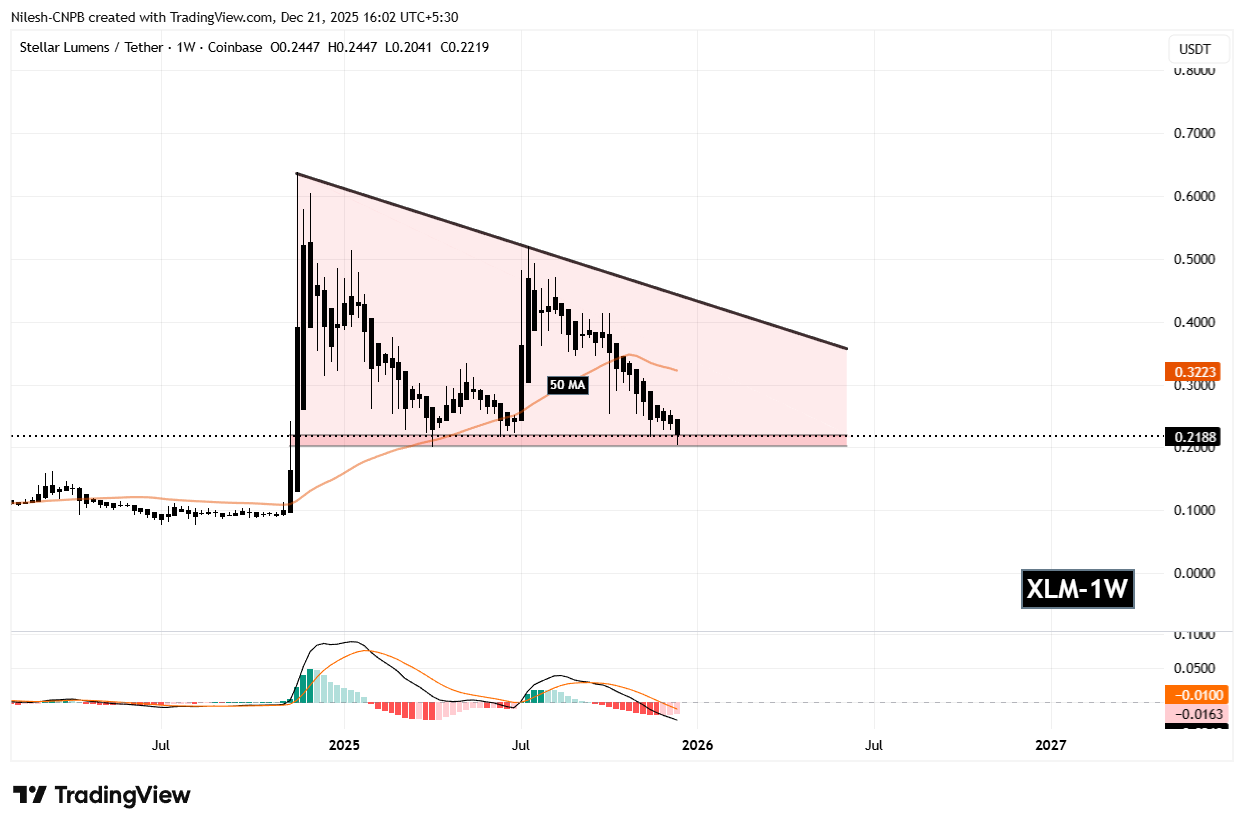
Stellar (XLM) Daily Chart/Coinsprobe (Source: Tradingview)
At the same time, XLM is trading below its 50-week moving average, currently near the $0.32 region. This moving average has historically marked important shifts in trend direction, and price behavior around it often determines whether rallies can gain traction or fade quickly.
What’s Next for XLM?
As long as the $0.20–$0.22 support zone remains intact, the probability of a rebound stays firmly on the table. A sustained defense of this level could allow XLM to stabilize and attempt a move back toward the descending trendline resistance near $0.32. This area aligns closely with the 50-week moving average, making it a key zone that bulls would need to reclaim to signal improving market structure.
A decisive weekly close above the descending trendline would be a notable technical development. Such a move would invalidate the bearish bias of the triangle and could open the door for a broader trend reversal, especially if accompanied by rising volume and improving momentum across the wider crypto market.
That said, the downside risk remains clearly defined. A weekly close below the $0.20 support would confirm a breakdown from the triangle and could expose XLM to deeper declines, with the next major support area sitting closer to the $0.13 region.
For now, Stellar sits at a pivotal inflection point. With price pressing against long-term support and sellers struggling to force a breakdown, the coming weeks are likely to be decisive in determining whether XLM can stage a meaningful rebound or extend its broader corrective trend.
Disclaimer: The views and analysis presented in this article are for informational purposes only and reflect the author’s perspective, not financial advice. Technical patterns and indicators discussed are subject to market volatility and may or may not yield the anticipated results. Investors are advised to exercise caution, conduct independent research, and make decisions aligned with their individual risk tolerance.
Disclaimer: The information on this page may come from third parties and does not represent the views or opinions of Gate. The content displayed on this page is for reference only and does not constitute any financial, investment, or legal advice. Gate does not guarantee the accuracy or completeness of the information and shall not be liable for any losses arising from the use of this information. Virtual asset investments carry high risks and are subject to significant price volatility. You may lose all of your invested principal. Please fully understand the relevant risks and make prudent decisions based on your own financial situation and risk tolerance. For details, please refer to
Disclaimer.
Related Articles
BNB Holds $600 as Hard Fork Nears and Bulls Eye Breakout
Key Insights:
BNB holds above 600 as traders lock profits while attention shifts toward Osaka. The Mendel upgrade is expected to influence short-term price direction.
Fast finality and fee stability improvements aim to attract institutional usage, while increased activity could accelerate to
CryptoNewsLand2h ago
Solana Price Compresses at Key Level as Security Upgrades Emerge
Key Insights
The Solana price compresses near the triangle apex as the EMA cluster and CRT range align, creating conditions that often precede sharp directional volatility expansion.
The quantum readiness report confirms Falcon integration, ensuring Solana can activate post-quantum
CryptoNewsLand2h ago
Shiba Inu Faces Pressure After Whale Offloads 800B Tokens
Key Insights
A single SHIB wallet sold 800 billion tokens for $4.9 million, yet still controls over 99 trillion tokens in remaining holdings.
SHIB price remains range-bound between $0.0000060 support
CryptoNewsLand2h ago
Shiba Inu Faces Pressure After Whale Offloads 800B Tokens
Key Insights
A single SHIB wallet sold 800 billion tokens for $4.9 million, yet still controls over 99 trillion tokens in remaining holdings.
SHIB price remains range-bound between $0.0000060 support
CryptoNewsLand2h ago
Chainlink Price Tightens Range as Breakout Pressure Builds
Key Insights:
Chainlink trades within a narrowing range as buyers defend support while sellers cap gains, creating a compression pattern that often precedes strong directional price moves.
Momentum weakens near resistance despite price holding above key averages, indicating reduced bullish s
CryptoNewsLand3h ago
Solana Price Weakens as Bearish Pattern Builds Below $90
Key insights
Solana trades near $83 after repeated rejection below $90, forming a rounded top pattern that signals weakening bullish momentum across lower timeframes.
The $78 to $80 support zone remains critical, as a breakdown could trigger further downside toward $75 and possibly extend lo
CryptoNewsLand3h ago